
Appearance
rocprof studioSee what your GPU actually did
A Rust + Tauri desktop app and headless core for reading rocprofv3, ROCPD, ATT and RADV captures — with an MCP server and kernel/shader tuning when you ask for them.
A Rust + Tauri desktop app and headless core for reading rocprofv3, ROCPD, ATT and RADV captures — with an MCP server and kernel/shader tuning when you ask for them.
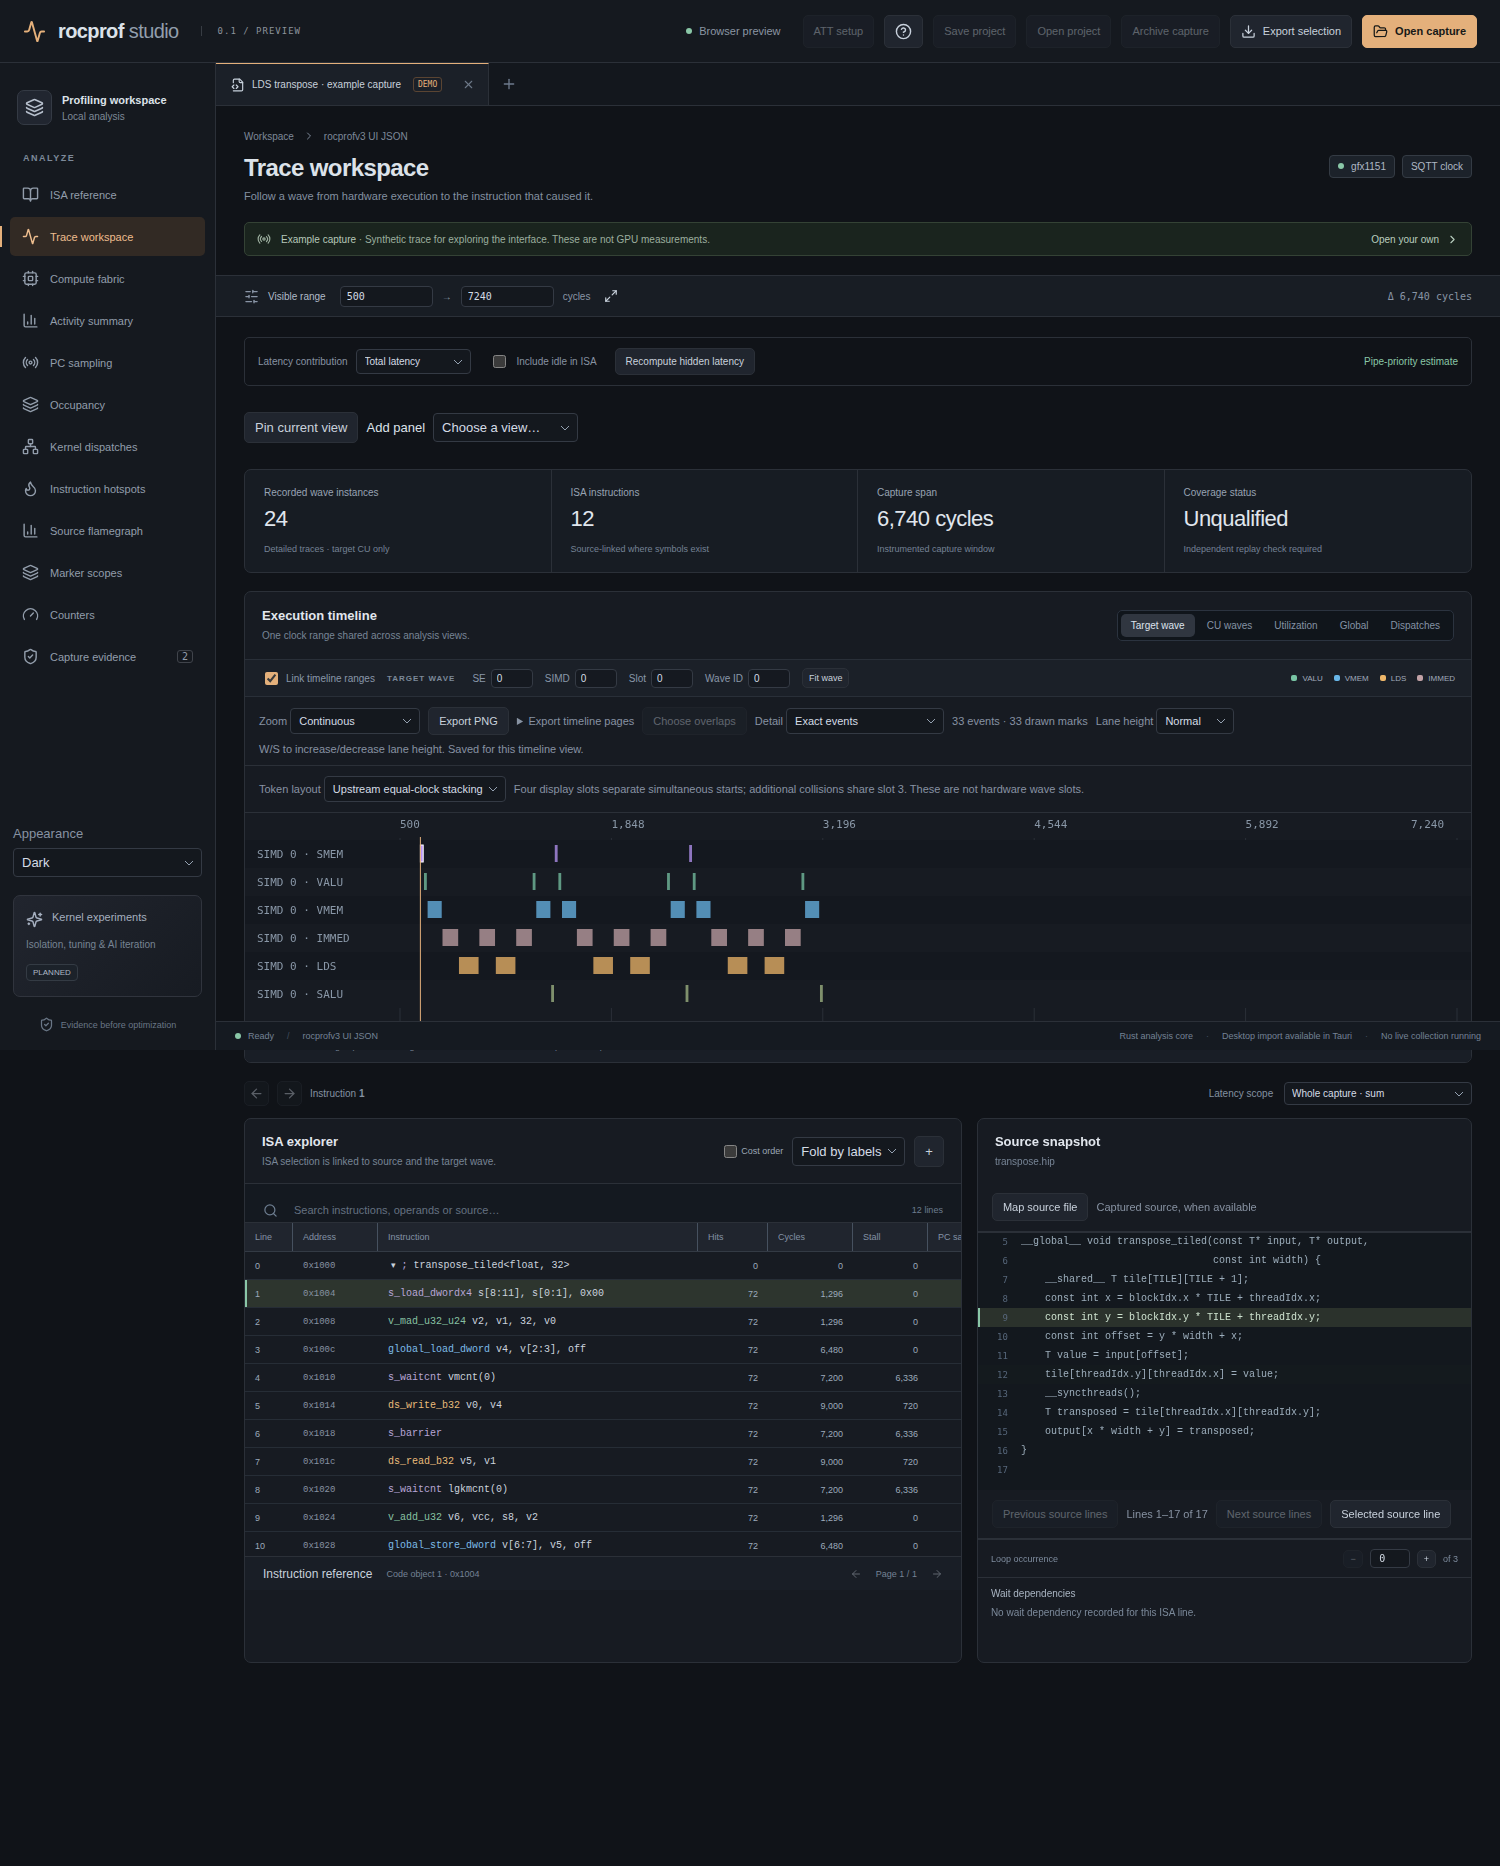
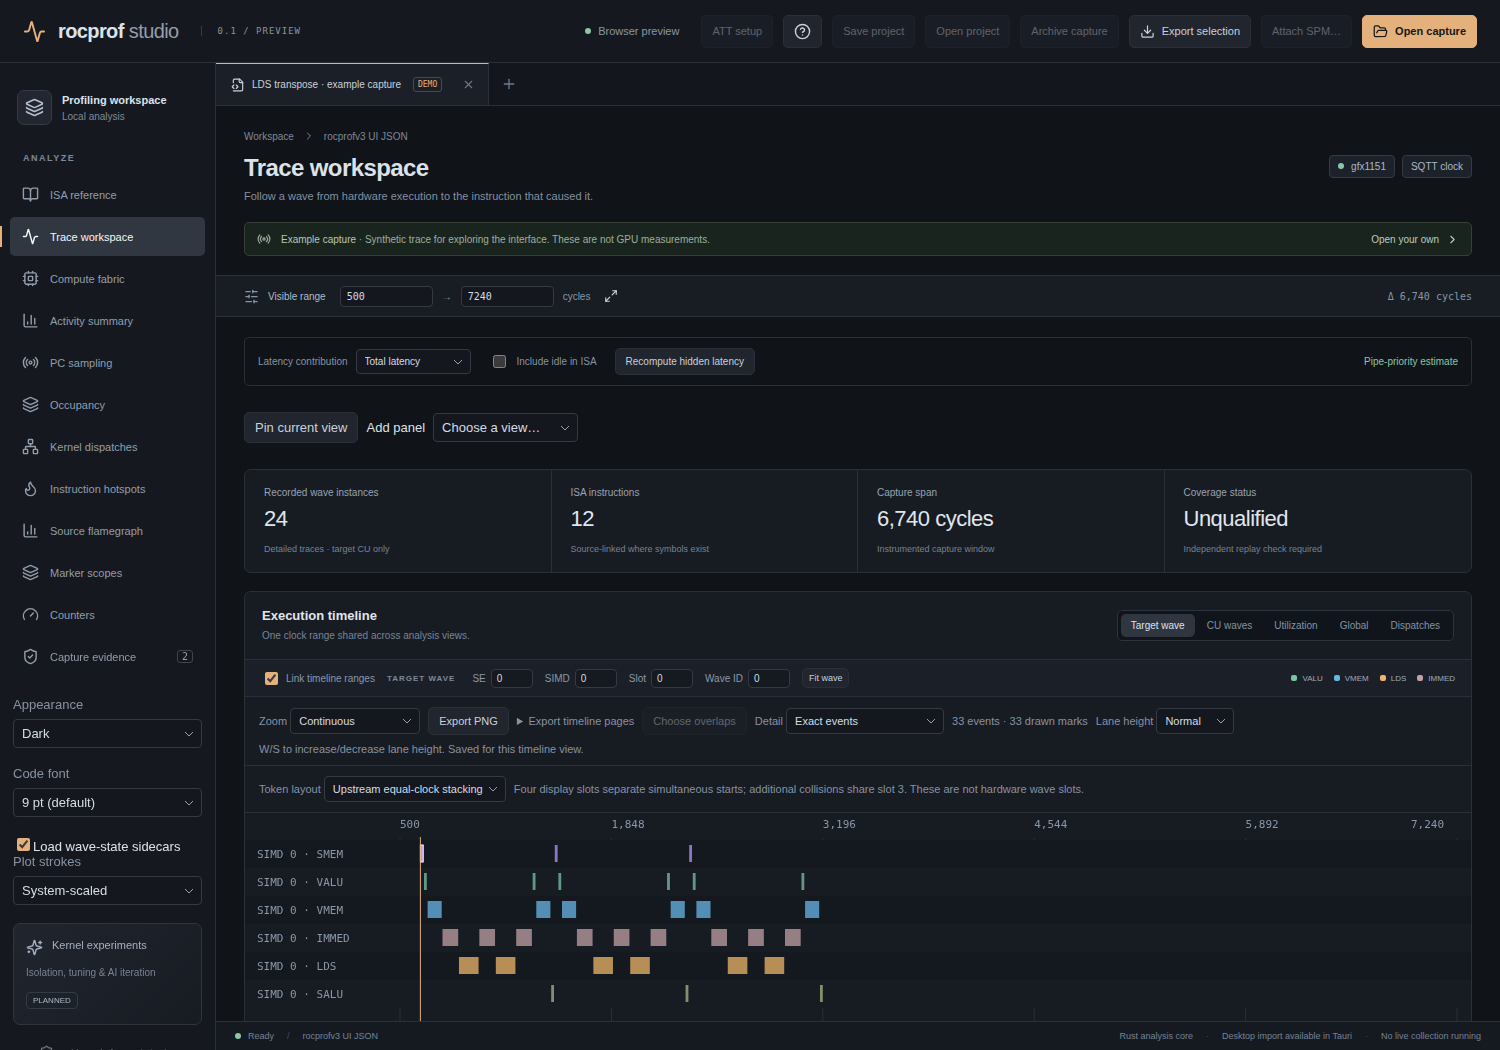
Follow a wave from hardware execution to the ISA that caused it and back to the source line.
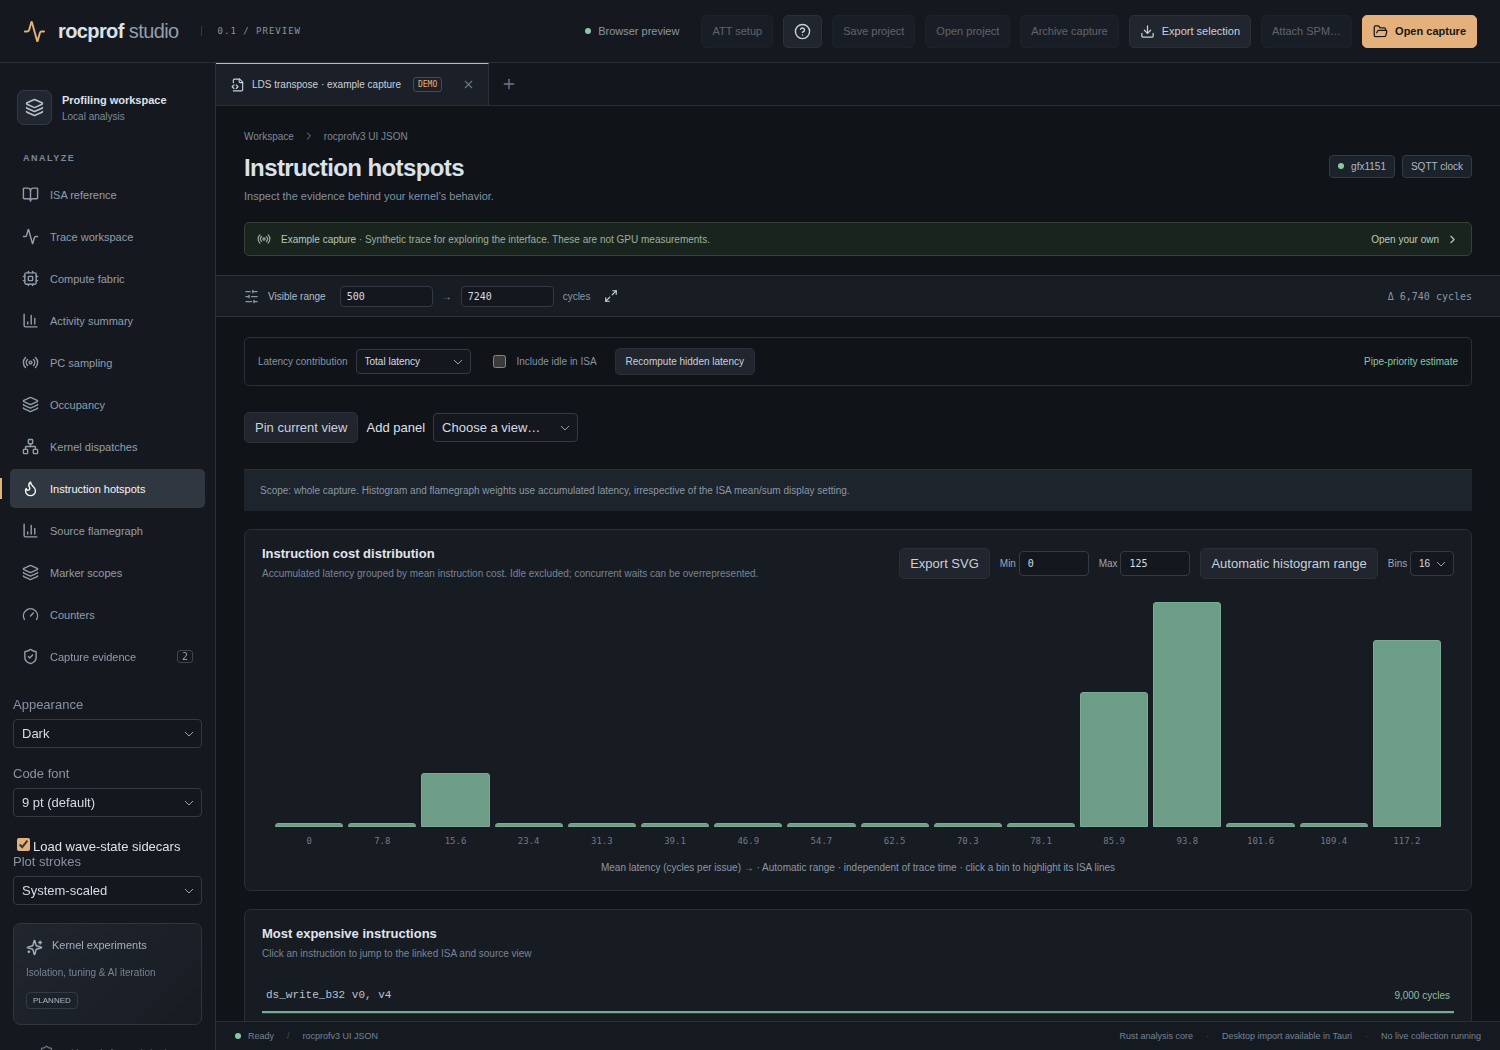
Which instructions dominated, by hits and by attributed cost.
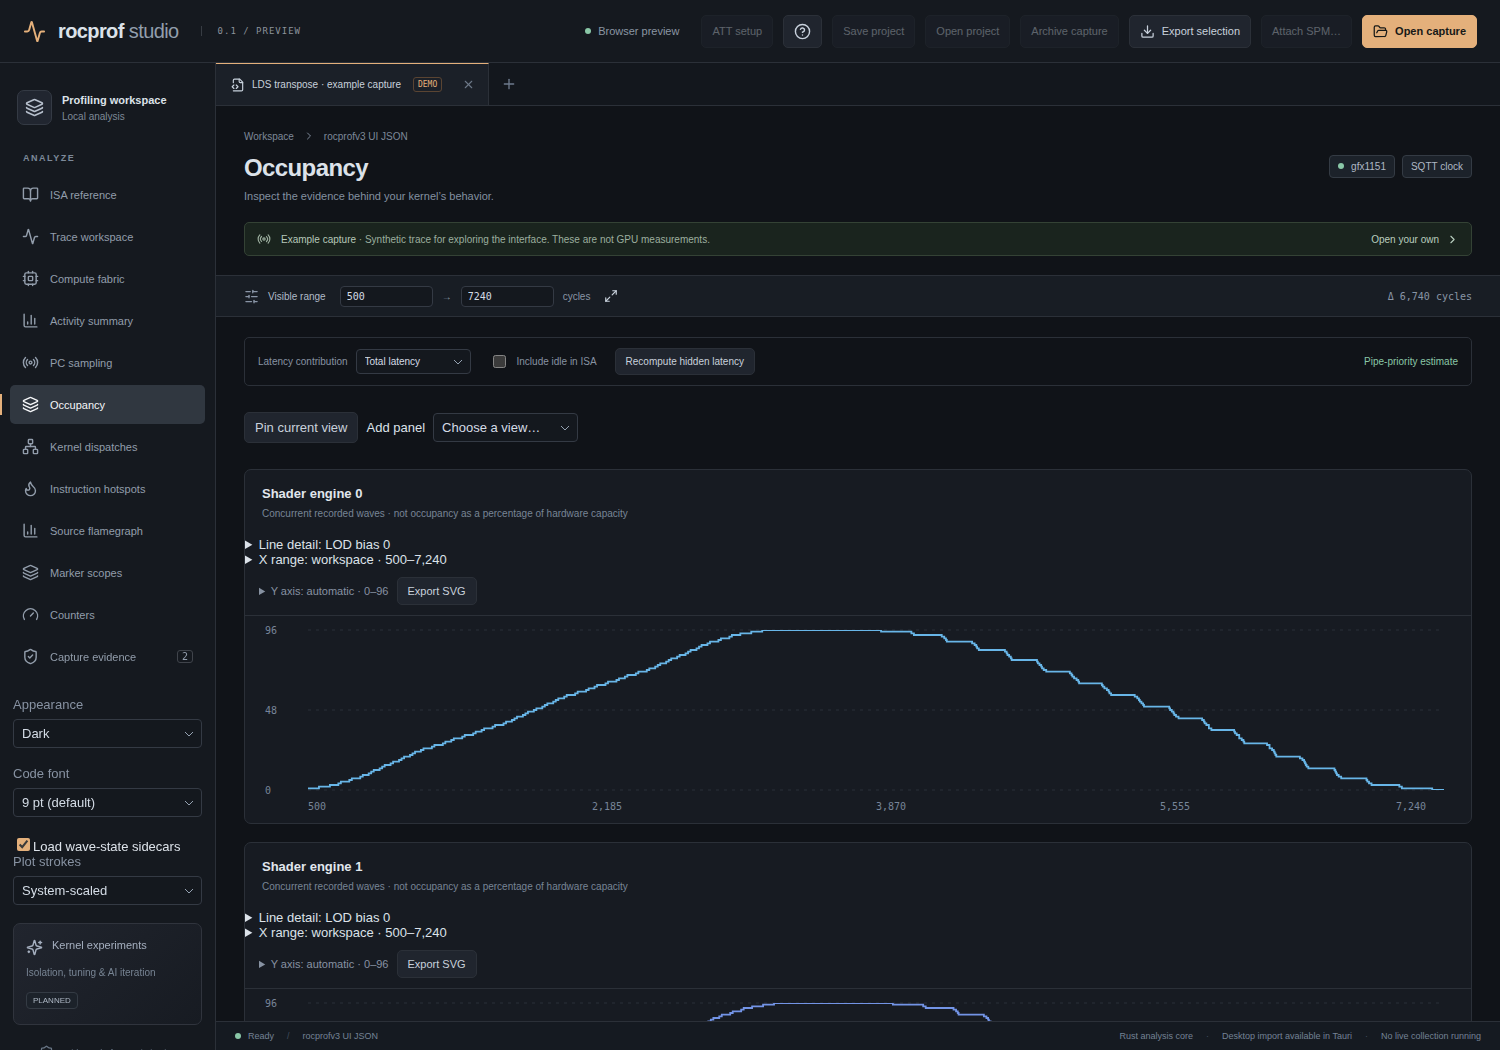
Per-SE and per-kernel wave residency over time, exportable as SVG.
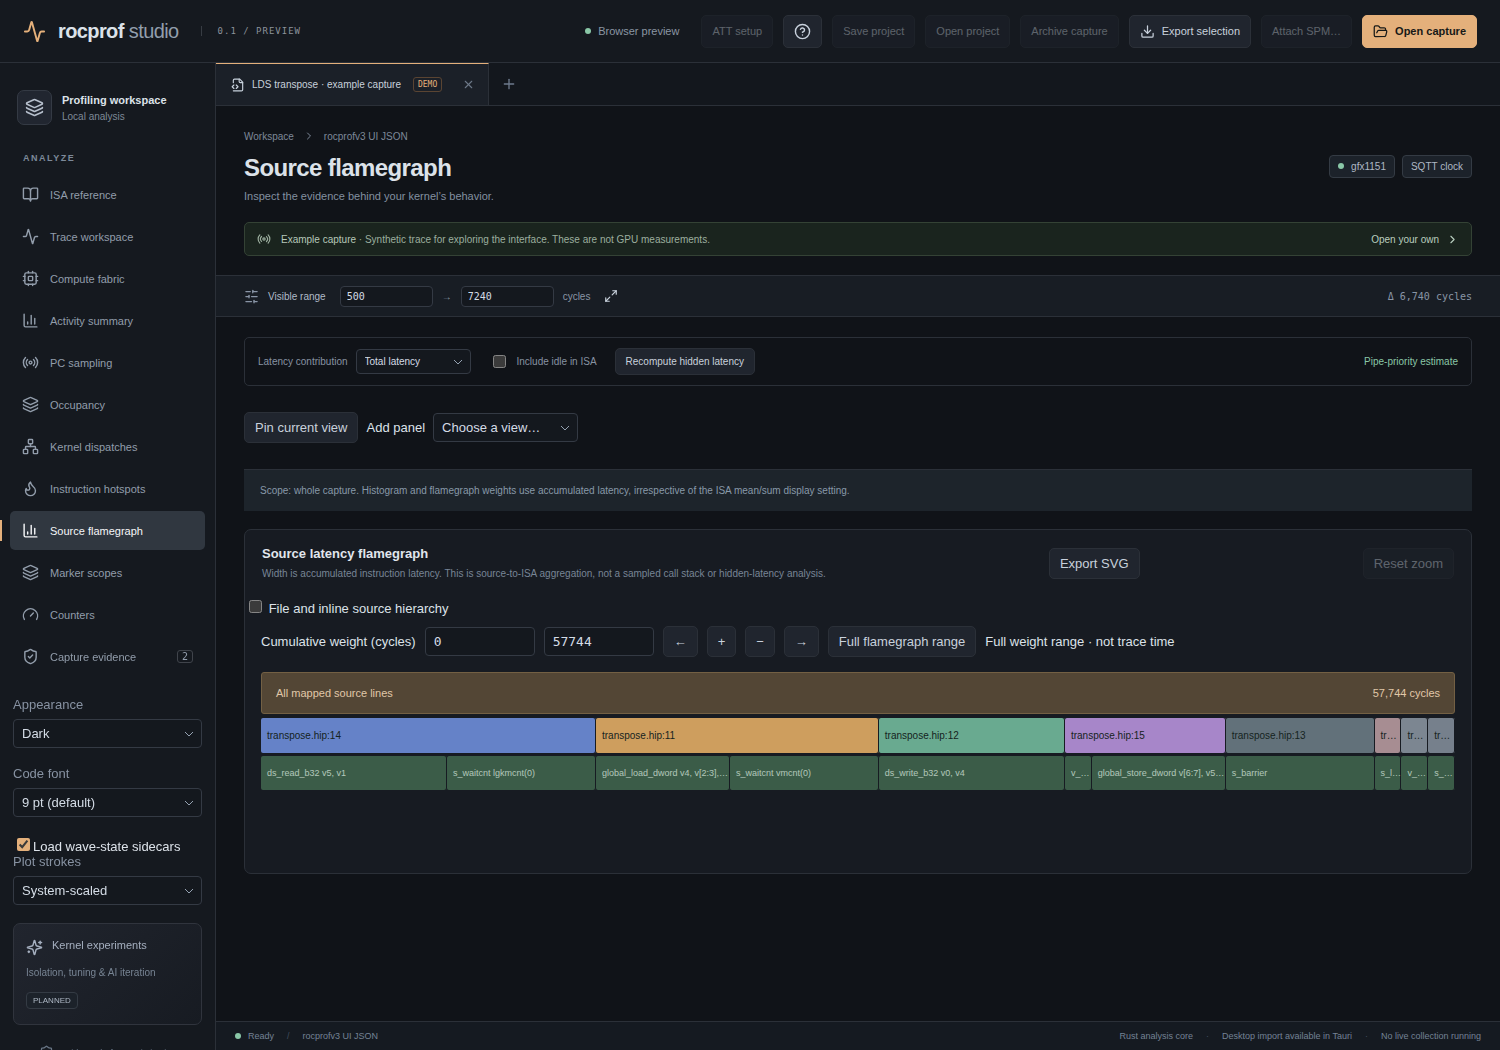
ISA cost rolled up through the source hierarchy.
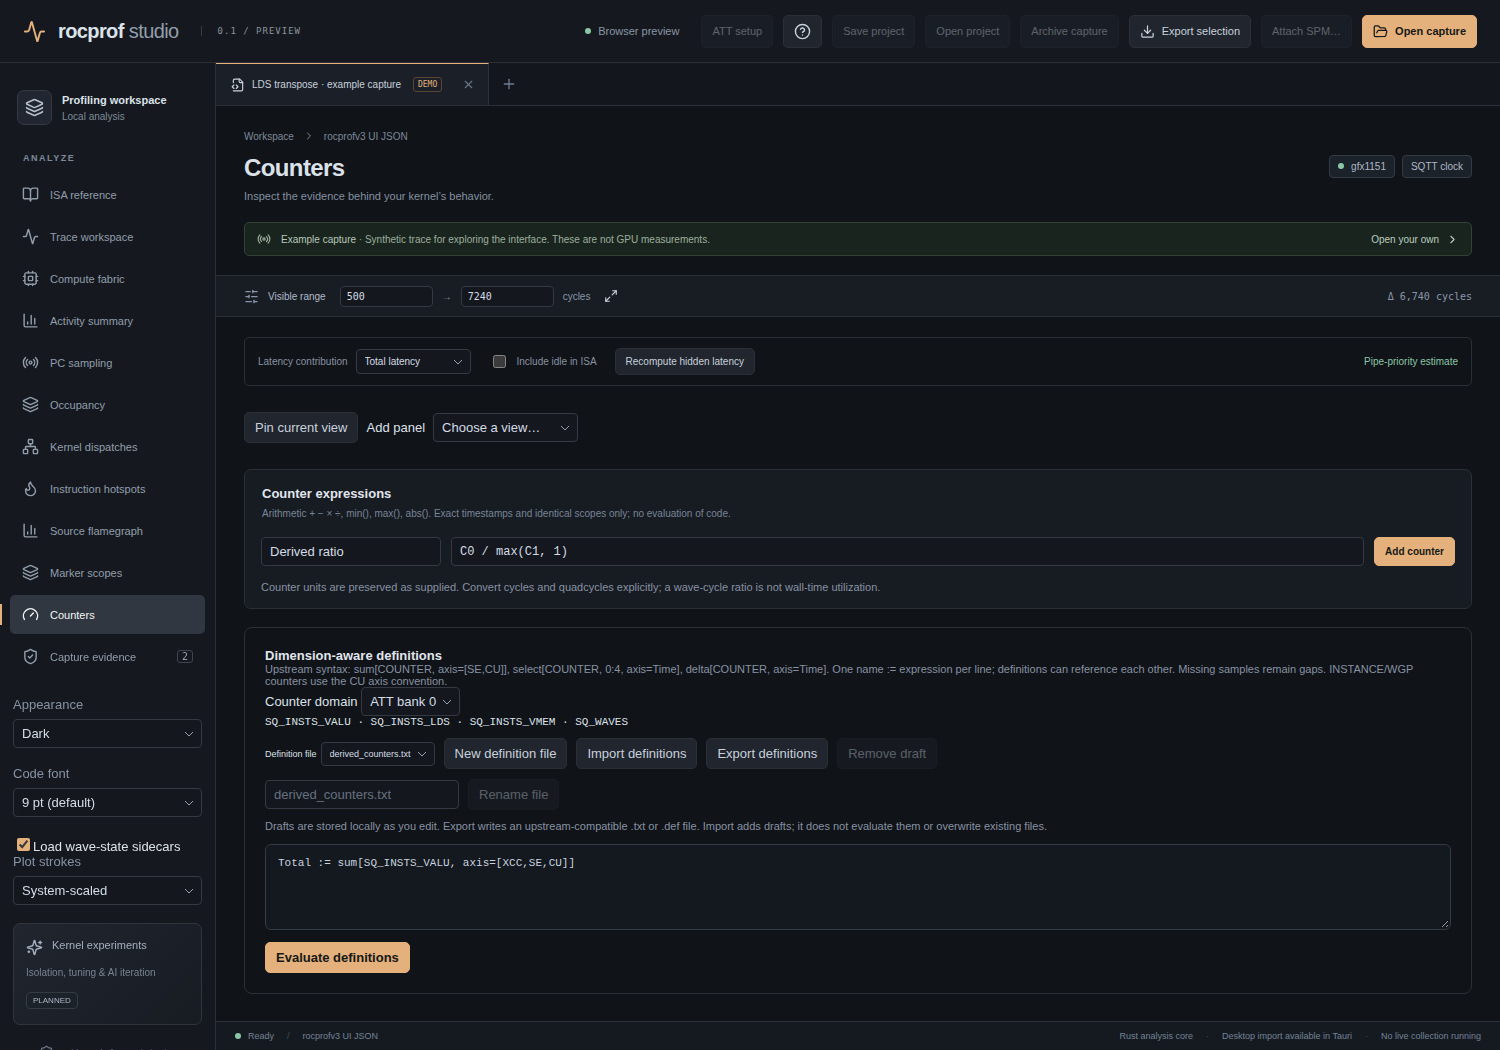
Scalar expressions and named-axis tensor definitions over recorded series.
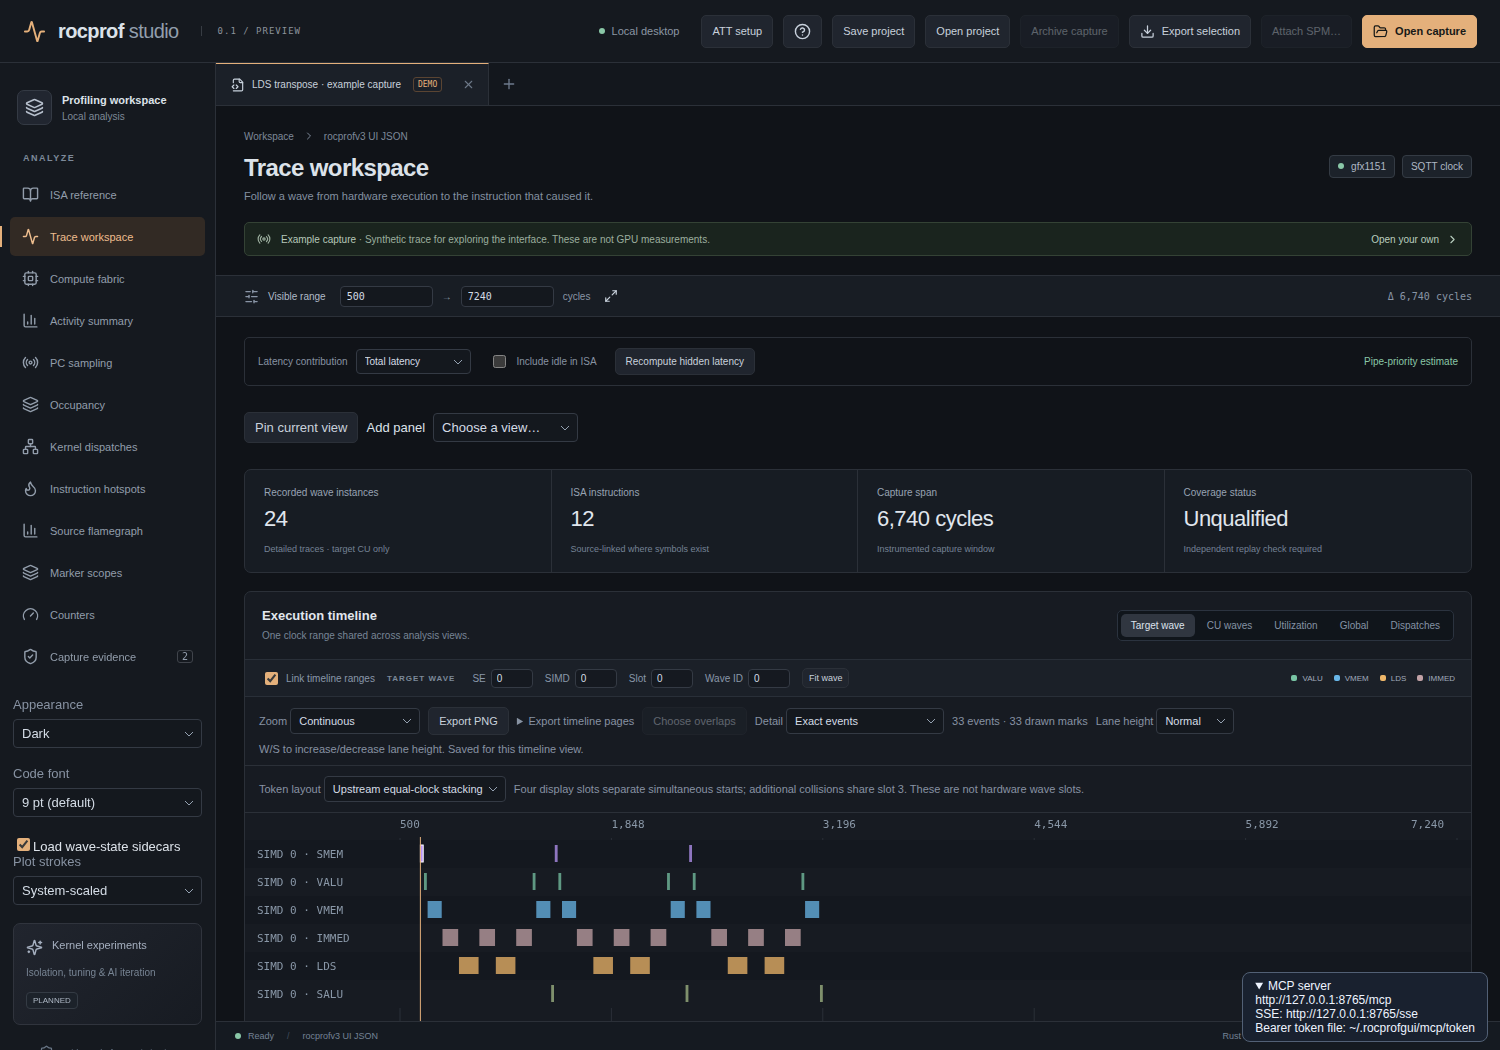
A loopback, bearer-token server with 31 tools for import, analysis, profiling and tuning.
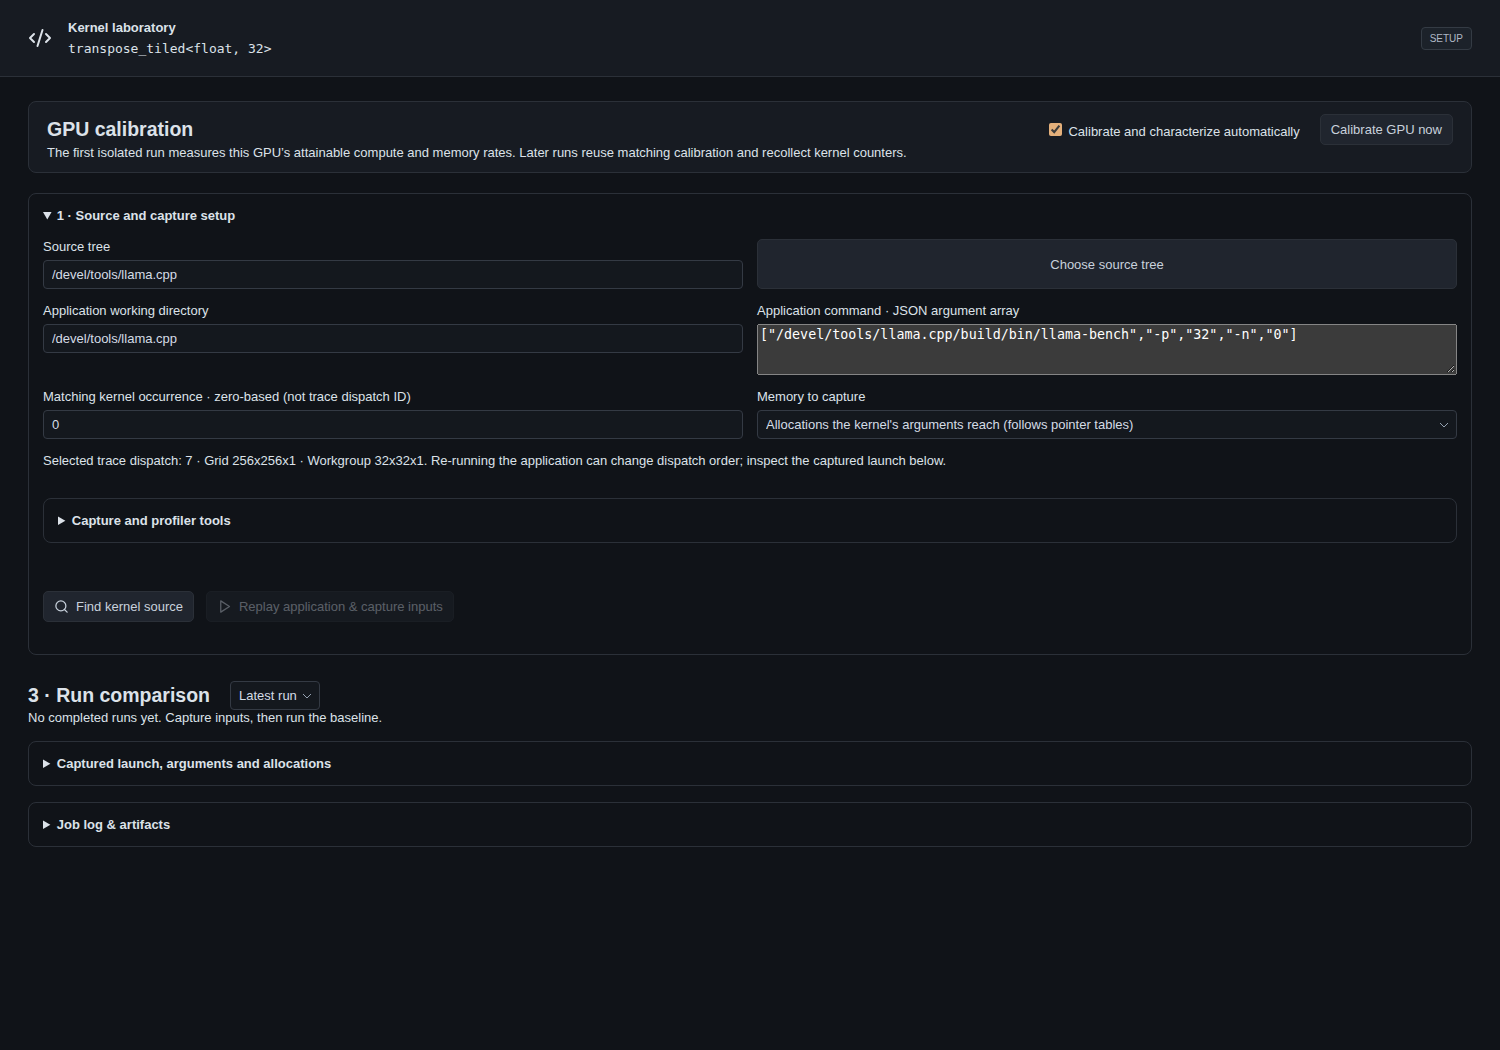
Capture a kernel’s inputs, replay it in isolation, compare variants. Opt-in, needs a GPU.
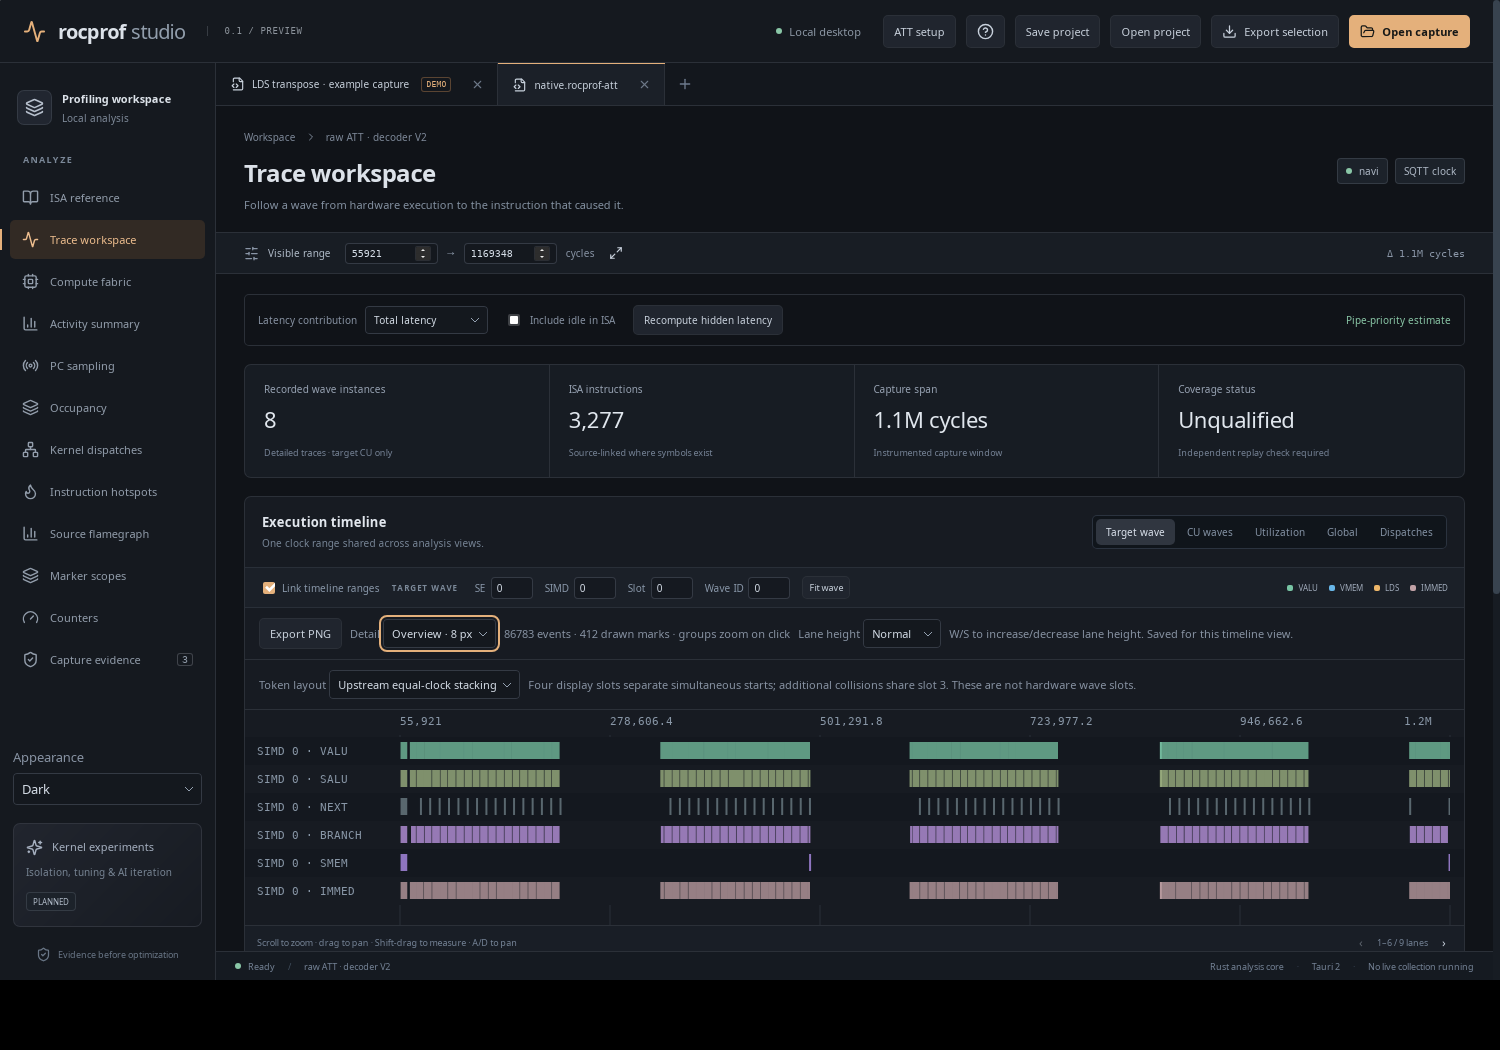
Exact events, upstream mip reduction or pixel aggregation — never silent sampling.
These screenshots use the bundled synthetic example
Most screenshots on this site were captured from public/demo.json, a synthetic trace shipped for exploring the interface. The app labels it "Example capture · Synthetic trace for exploring the interface. These are not GPU measurements." Treat every number in those images as illustrative, never as a hardware measurement. Screenshots taken from real recorded captures (ROCPD, ATT) are captioned accordingly.
rocprof studio (package rocprof-studio, version 0.3.0, badged PREVIEW in the app) says no more than it can back up. Three things first:
profile_run (and profile_start) launches a program under a profiler; the kernel- and shader-tuning workers compile candidate variants and can write replacement source back to disk. See MCP mode, Kernel tuning and Shader tuning.It inspects ROCm GPU profiling captures. A single Rust analysis core (crates/profile-core) does the importing and analysis; a Tauri 2 shell (src-tauri) wraps it with a React/TypeScript UI (src), and the same core also runs as a headless importer CLI and behind the MCP server. You point it at the artifacts a profiler already produced and it reconstructs the timeline, the per-wave execution, the ISA, the source linkage, occupancy, counters and sampling, then lets you export evidence about what you saw.
It reads decoded rocprofv3 directories, kernel-trace and counter CSVs, SPM and PC-sampling JSON, ROCPD/legacy databases, raw ATT and RADV .rgp — all through one analysis core shared by the GUI and the headless CLI. Synthetic values are labelled, "not collected" is shown distinctly from an observed zero, and summed-duration vs interval-union accounting is kept separate.
If you are new, start with Installation, then Running & modes, Input formats and the UI tour. If you came for automation, go straight to MCP mode.