
Appearance
UI tour
A tour of the interface, from the window down to the timeline controls. Every screenshot showing the LDS transpose · example capture is the bundled synthetic example, not a GPU measurement.
The workspace
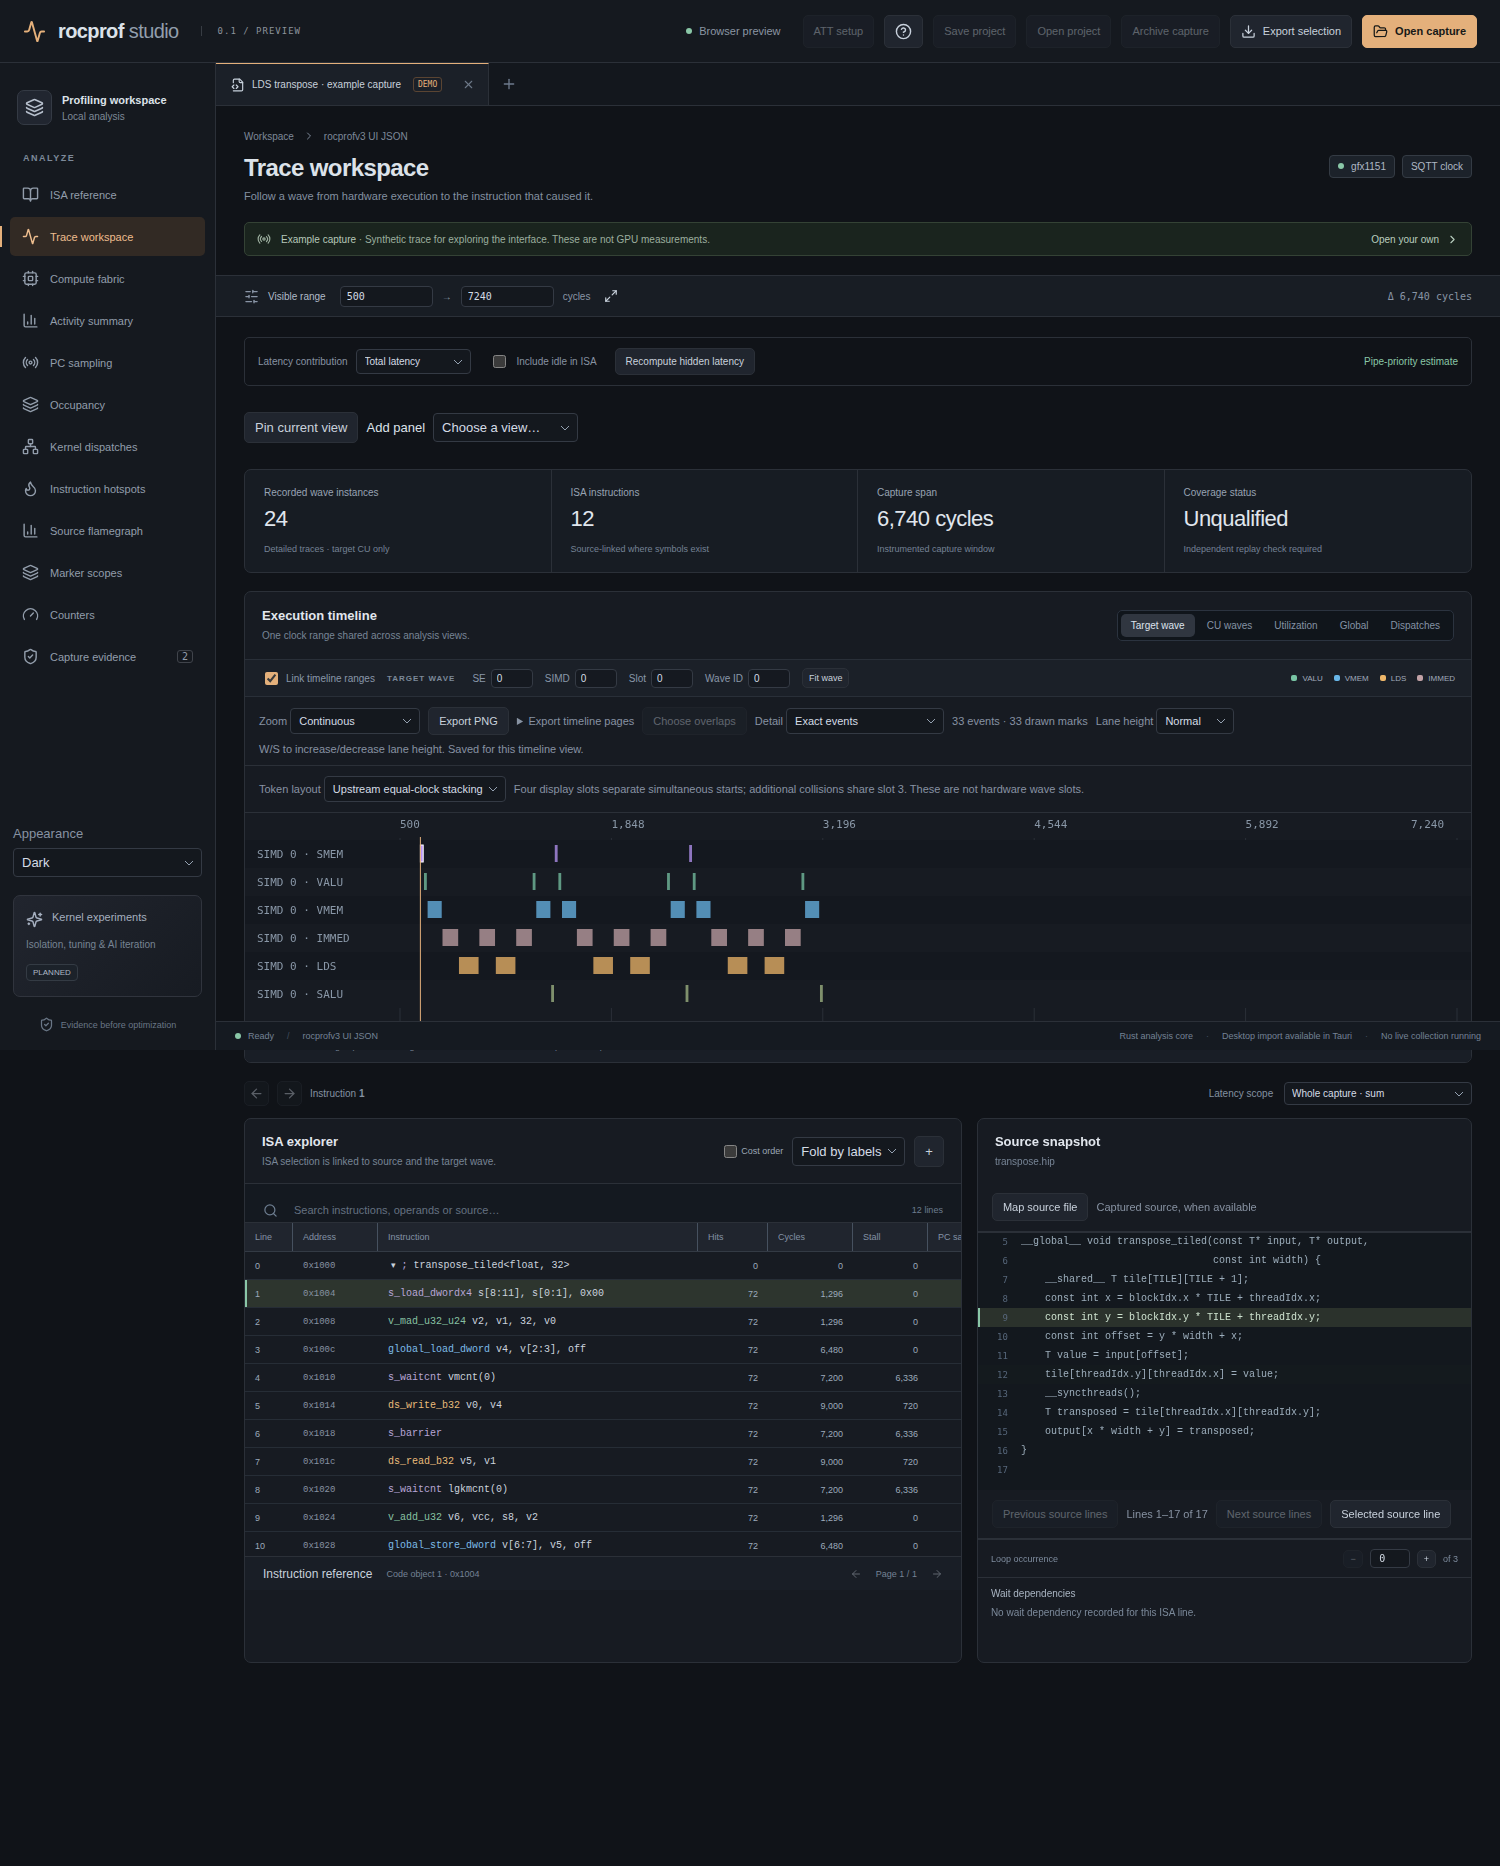 The full trace workspace in browser preview, showing the synthetic example: capture tab, sidebar, summary cards, the execution timeline, and the linked ISA explorer + source snapshot below it.
The window has three regions: the top bar (project/capture actions on the right, a "Browser preview" or "Local desktop" indicator), the sidebar (workspace identity, the view list, and appearance controls at the bottom), and the main area (capture tabs, then the active view).
Capture tabs and import
Capture tabs hold up to six native captures plus the bundled example. The + button beside the tabs ("Open capture file") opens the native picker; the top-bar Open capture does the same. The picker filter and directory mode are covered in Input formats. The top bar also has ATT setup, Save project, Open project, Archive capture, Export selection and Attach SPM…, plus a Load wave-state sidecars import toggle in the sidebar.
Importing is read-only; nothing in the import path launches a profiler. Profiling runs only when you start it, either through the MCP profile_run/profile_start tools or from the desktop Live profiling sidebar panel, which drives the same core (see MCP mode): pick the tracer, enter the argv and working directory, and trigger timed or triggered windows with their streams, counters, ATT sub-options (targetCu/simdSelect/bufferSize/shaderEngineMask), kernel include/exclude regexes and a kernel iteration range. The window duration is validated against the MCP schema's 1–600000 ms bound, and errors read in the panel's own vocabulary rather than raw MCP tool names.
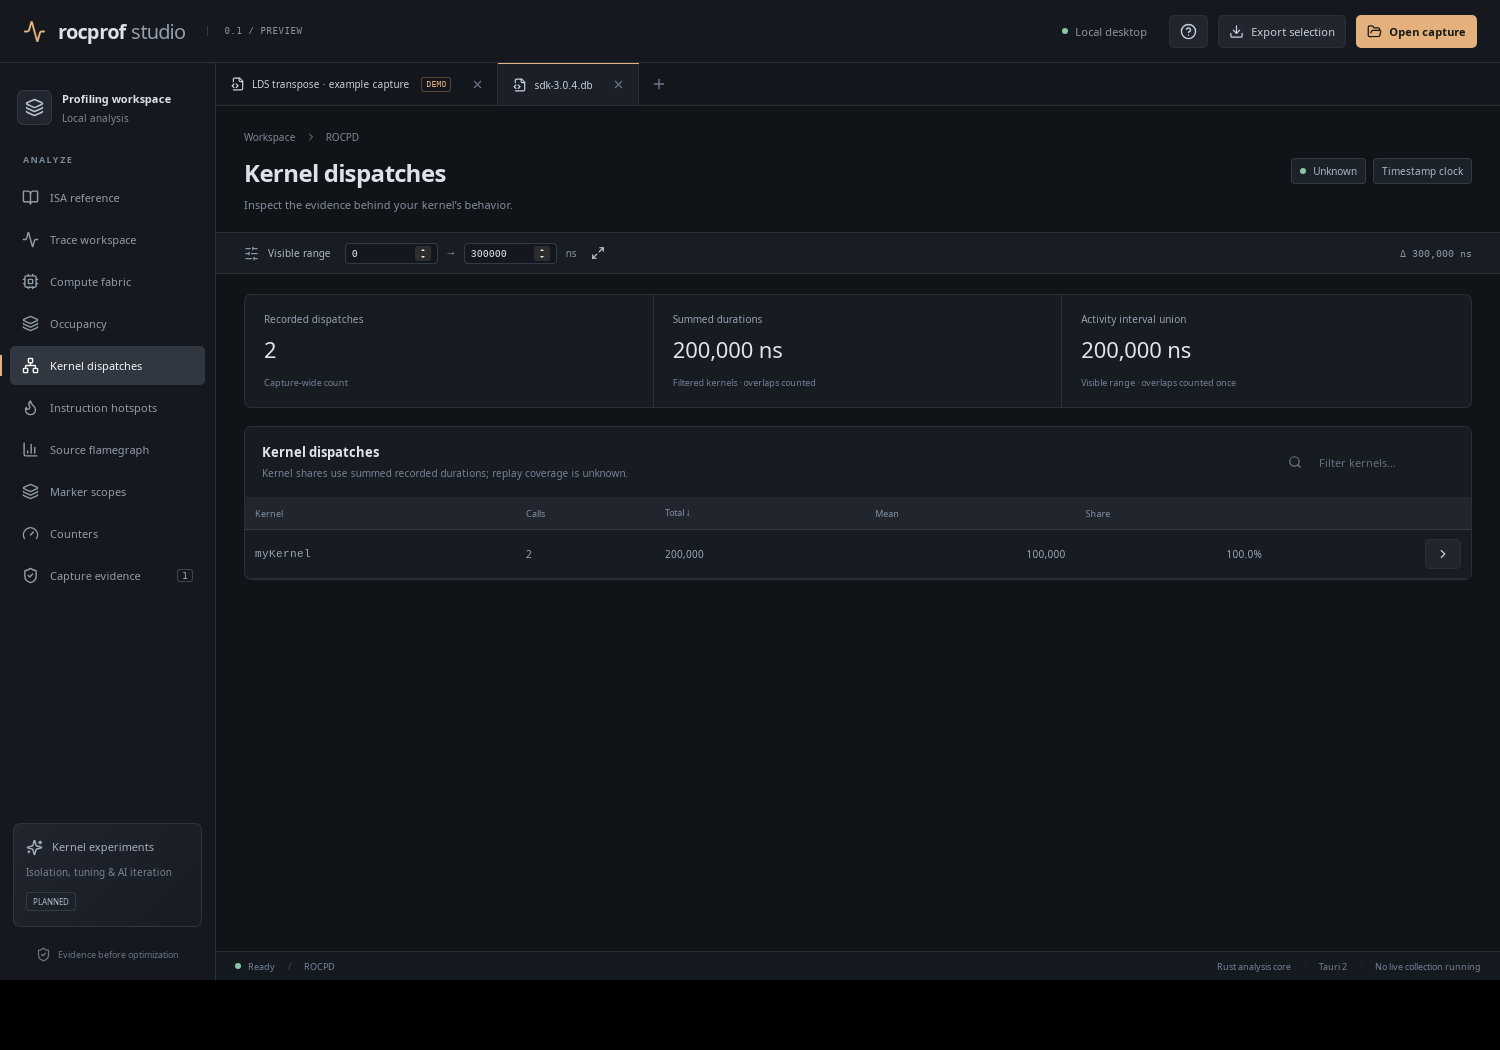 Importing a ROCPD/SQLite database in the desktop app (real recorded data from the
 sdk-3.0.4 fixture). ROCPD support is "Partial".
The sidebar and views
The sidebar lists twelve views, in order: ISA reference, Trace workspace, Compute fabric, Activity summary, PC sampling, Occupancy, Kernel dispatches, Instruction hotspots, Source flamegraph, Marker scopes, Counters, Capture evidence. The Capture evidence entry carries a badge with the capture's warning count. Each is documented in the Views reference.
The dockable workspace
The Trace workspace is a recursive binary split tree of panels (DockTree). You can Pin the current view, Add panel from a dropdown, and arrange panels into splits; a pinned trace-* panel gets its own timeline and, when Link timeline ranges is off, its own clock range. There is no float, tear-off or drag-and-drop: placement is a target×position selector and the only removal is Unpin. The layout is saved per capture into the .rocprof-project file (not localStorage). See Projects.
The trace timeline
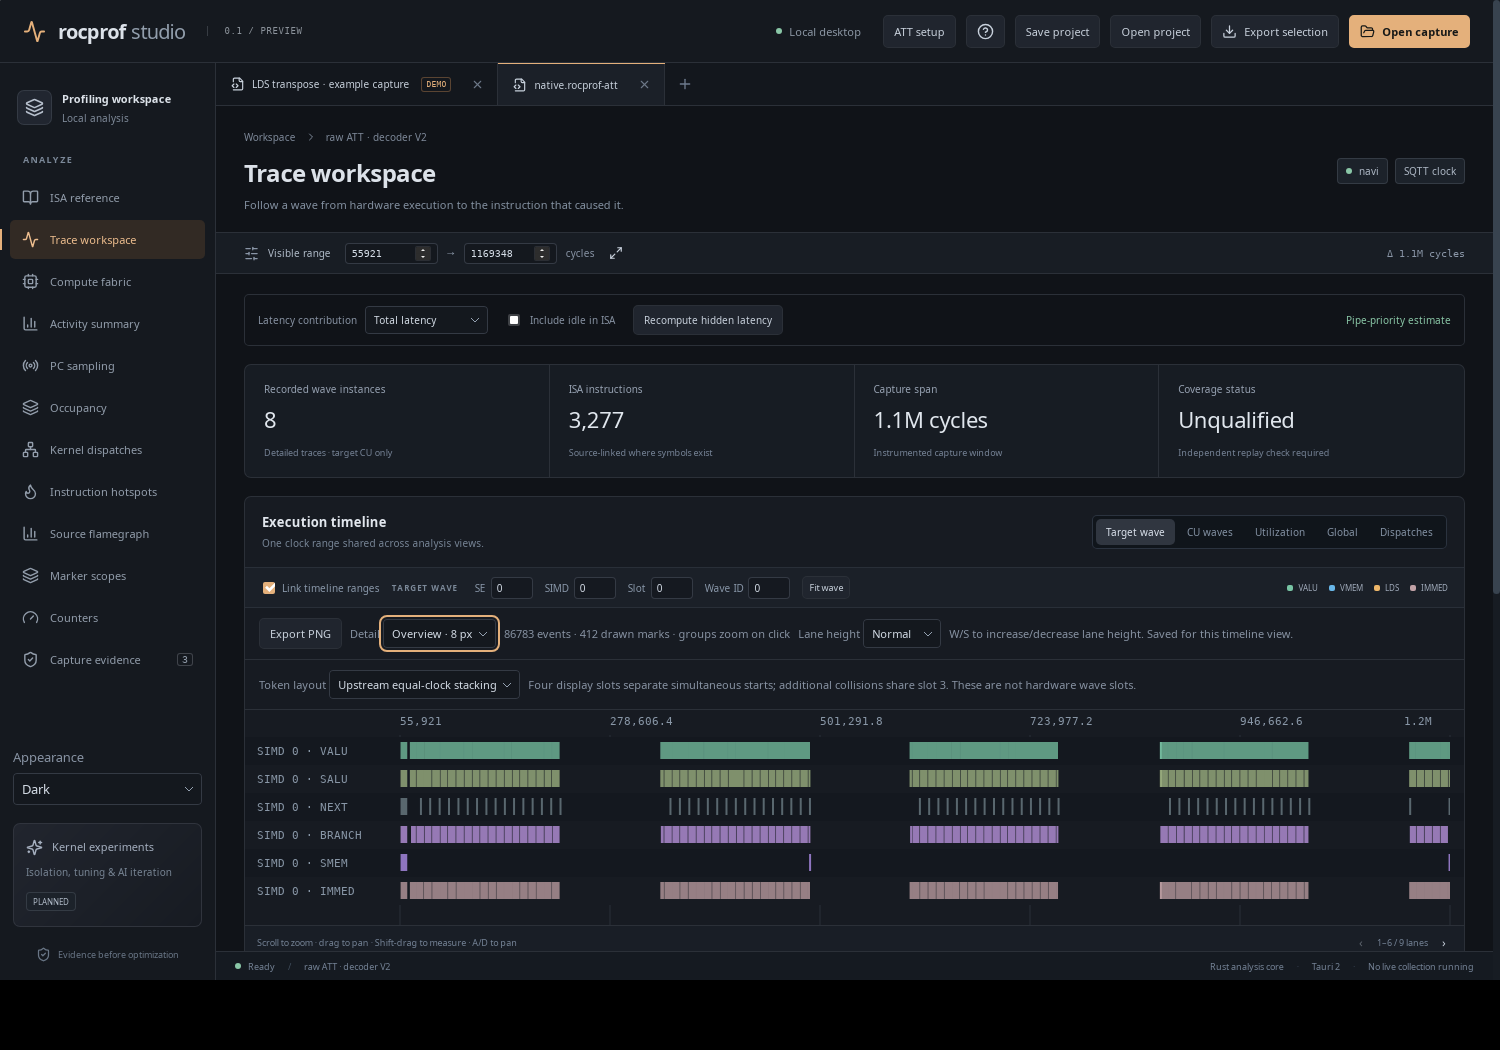 The execution timeline with its Detail menu (desktop app).
The timeline shares one clock range across analysis views (toggle Link timeline ranges off to give each panel its own). Controls:
- Range / zoom / pan. Scroll to zoom, drag to pan, A/D to pan, Shift-drag to measure. The Visible range inputs accept exact cycle bounds.
- Detail menu: Exact events, Upstream mip · automatic, or fixed 2/4/8-pixel aggregation. This is a bucketed approximation, not pixel-identical Qt rendering.
- Zoom menu: Continuous or Upstream mip steps (−2…10).
- Lane height (Compact → Large; W/S shortcuts) and Token layout (upstream equal-clock stacking vs flat bars).
- Choose overlaps / Alt-click / O selects a record hidden under another bar.
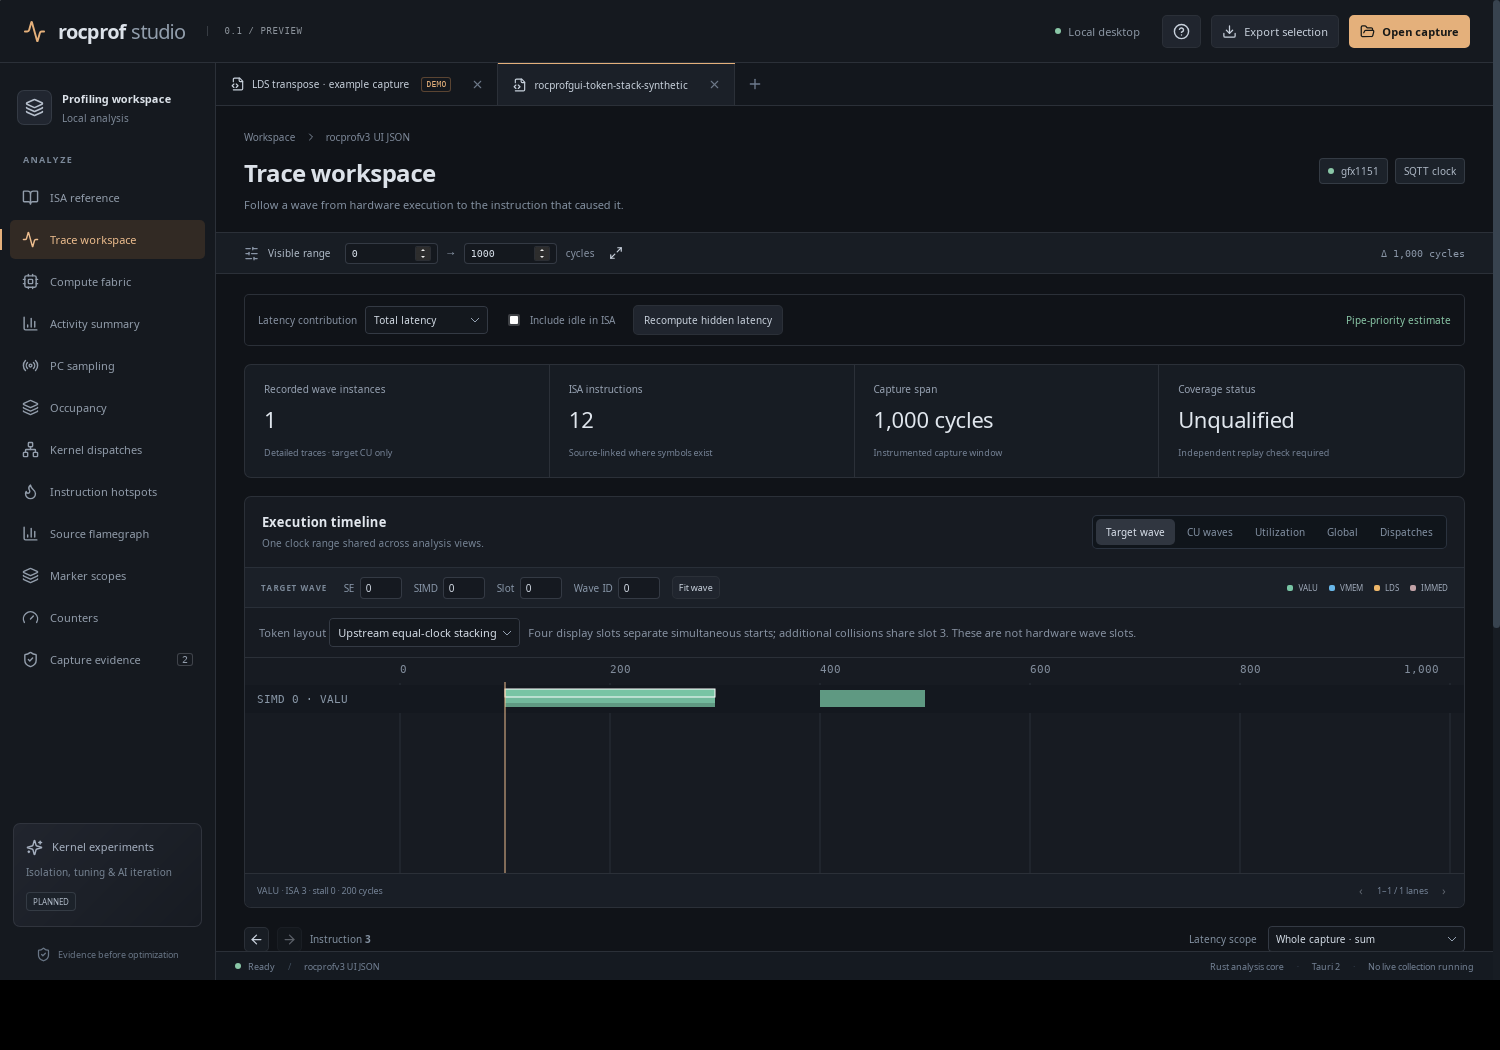 Equal-clock token stacking. "Four display slots separate simultaneous starts … These are not hardware wave slots."
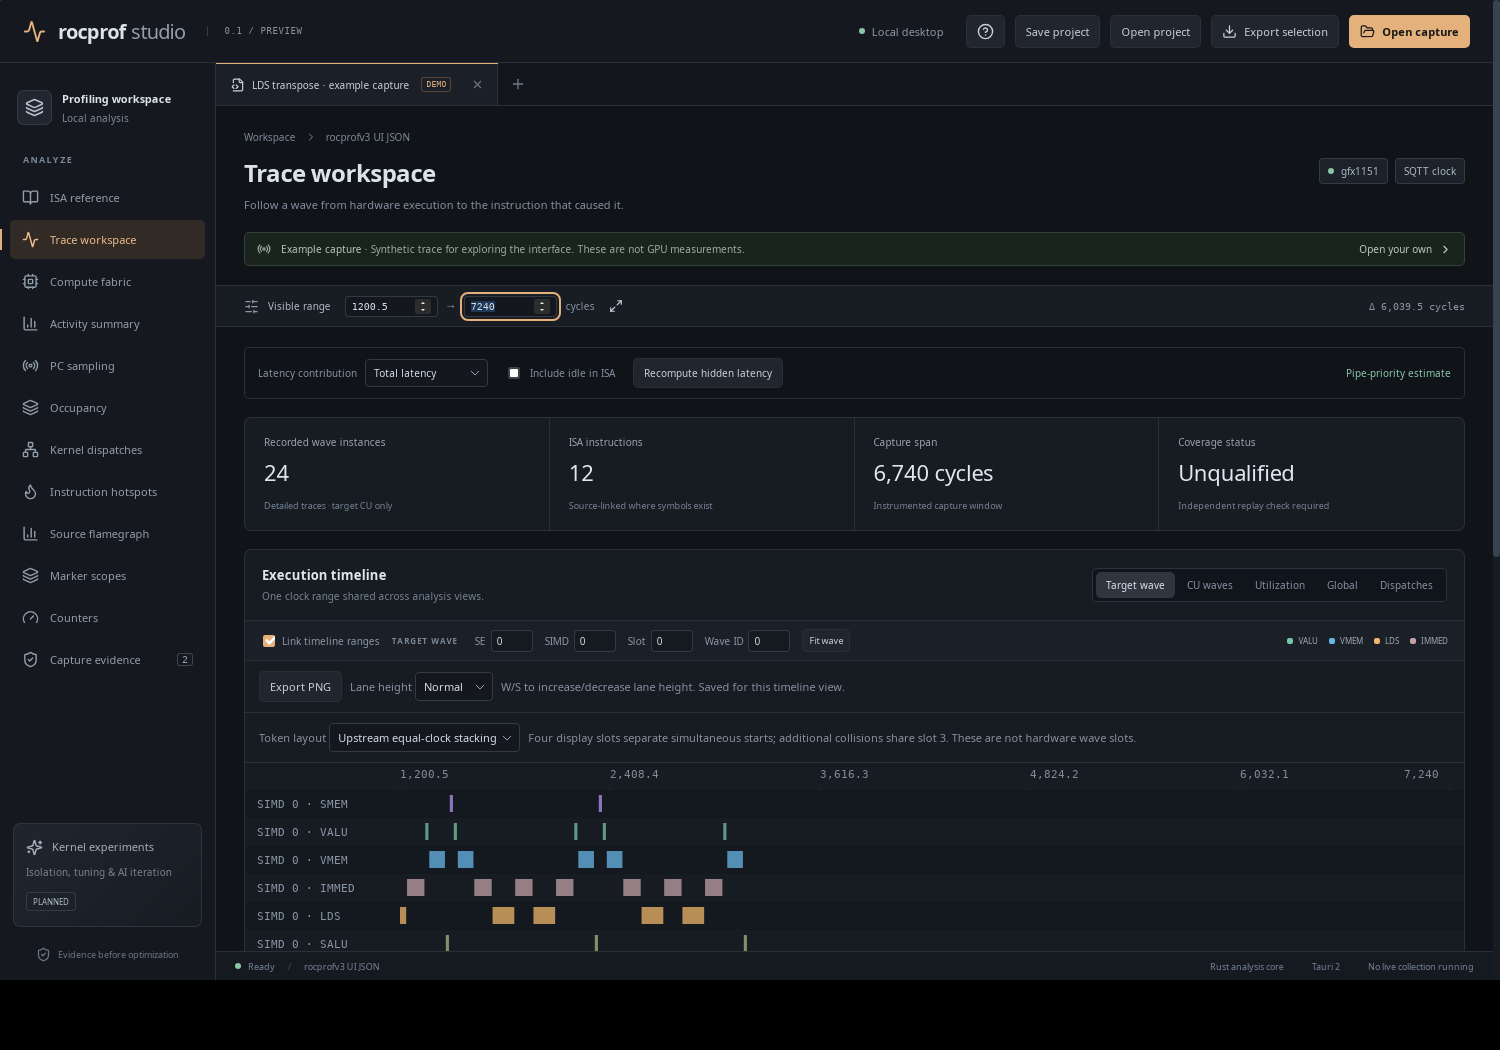 Shift-drag measures a range; committing it drives the linked views.
Dark and light theme
Appearance is a sidebar control (Dark / Light). It also carries code-font size and plot-stroke scaling.
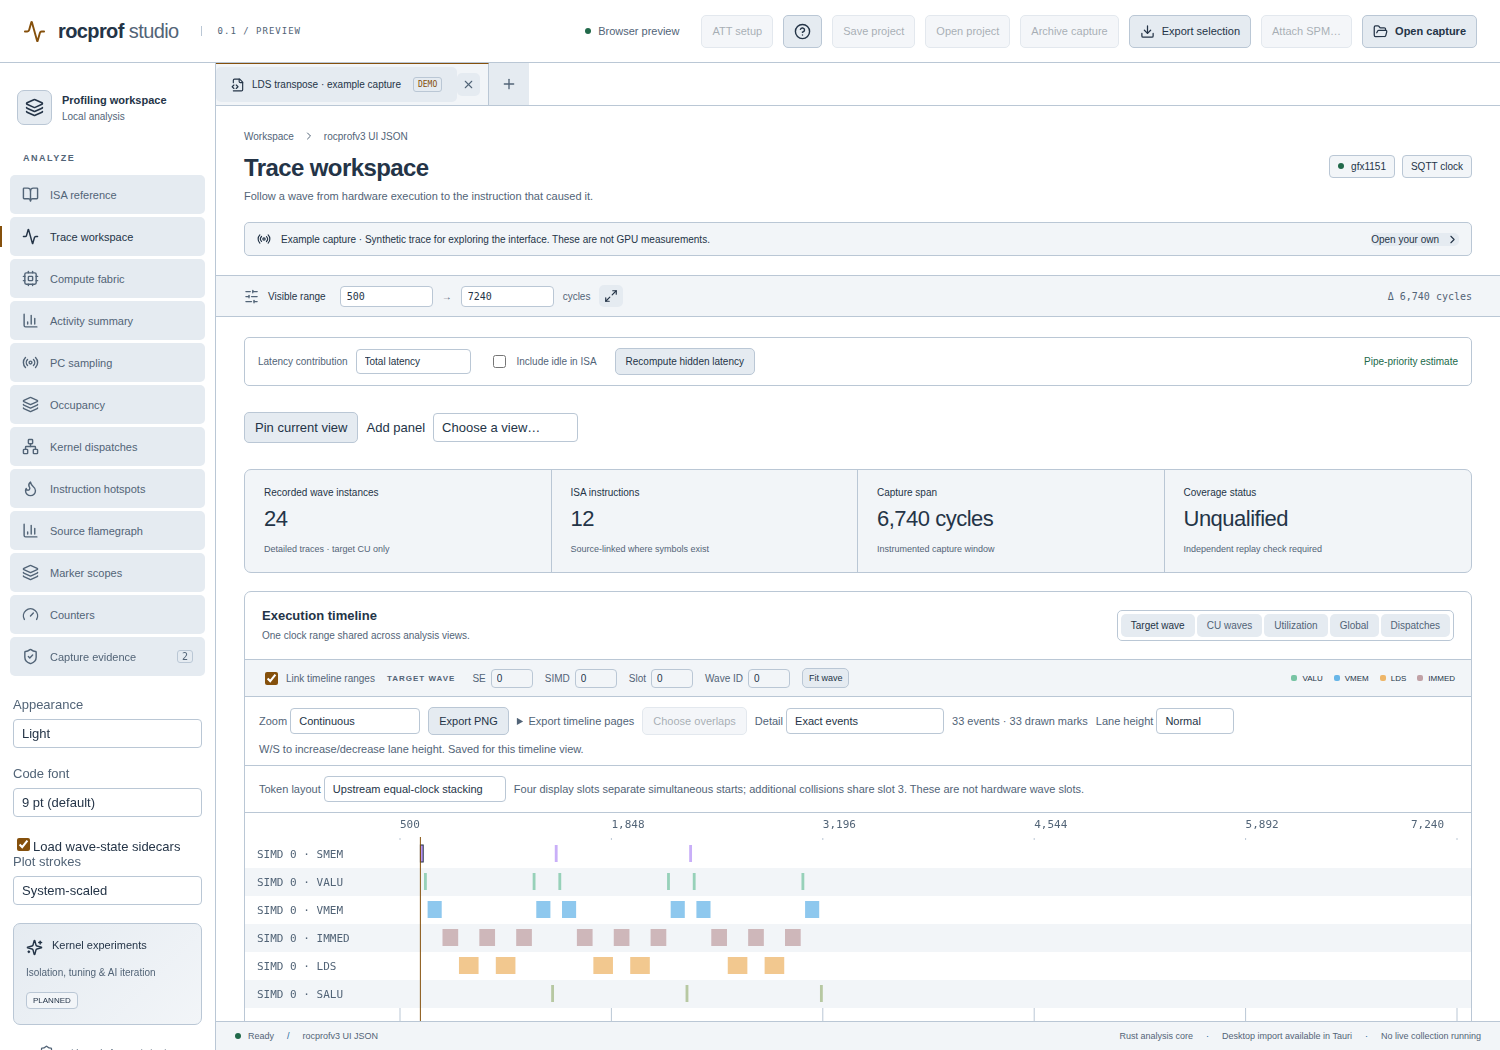 The same trace workspace in light theme.
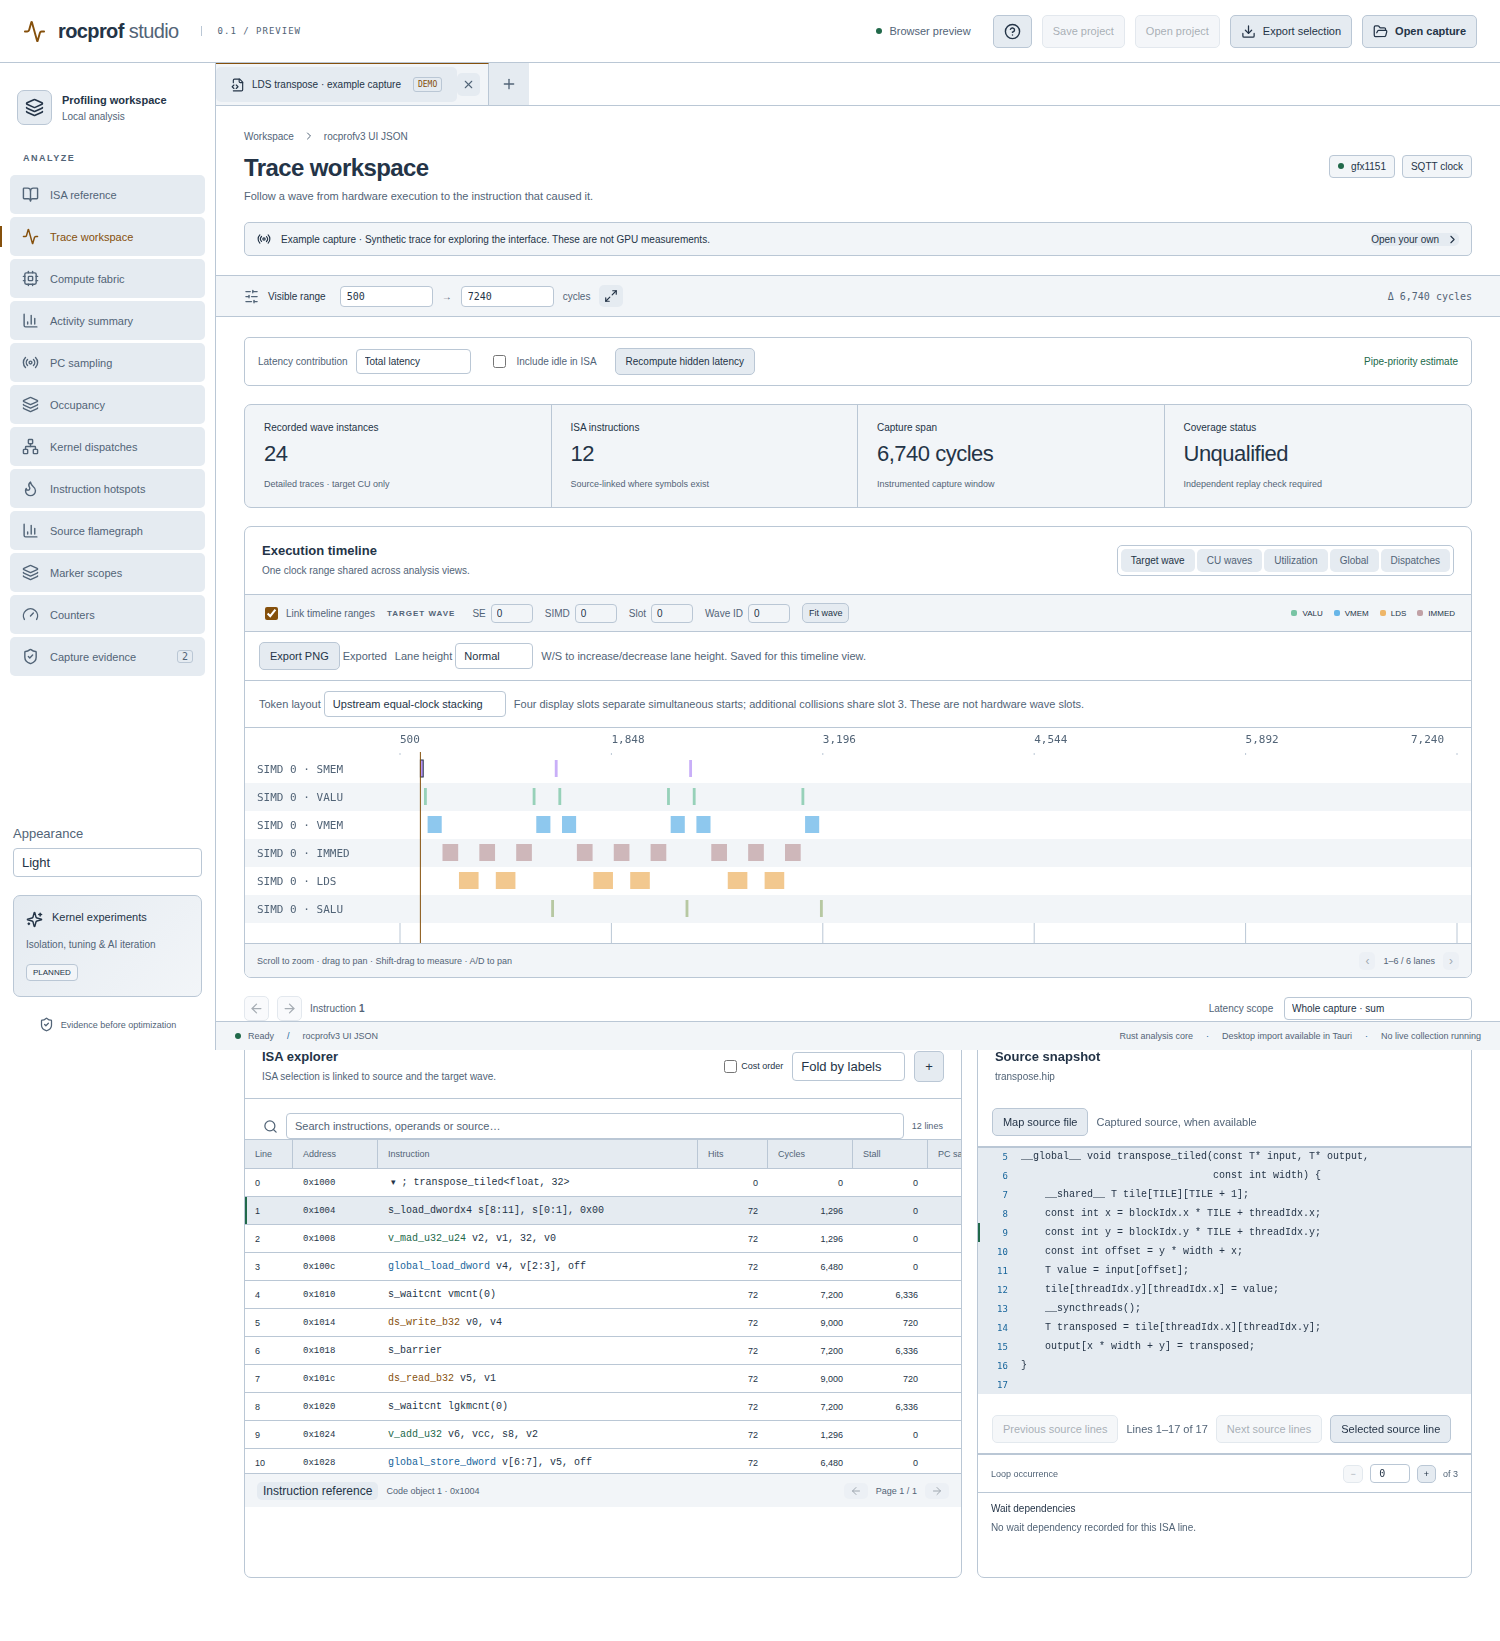 Light theme in the desktop app.
Next: the Views reference describes each analysis panel and what its numbers mean.