
Appearance
MCP mode
rocprof studio ships an MCP (Model Context Protocol) server. It is how an agent (Claude Code, Claude Desktop, or any MCP client) drives import, analysis, evidence export, profiling and tuning without a human at the keyboard. This chapter is the complete reference.
What it is
- A loopback HTTP server (
tiny_http) bound to127.0.0.1, on by default on port 8765 on every desktop launch. It is not a stdio server. - Two transports on it:
/mcp(Streamable HTTP/SSE) and the legacy/sse+/messages?sessionId=pair. - Bearer-token auth. A token file (default
~/.rocprofgui/mcp/token, relocated byROCPROFGUI_HOME, moved alone by--mcp-token-file) is auto-created0600with 32 random hex bytes if absent and must be ≥ 32 chars. Requests needAuthorization: Bearer <token>; anything else gets 401, and a non-loopbackHost/Origingets 403. - Who can reach it: any local process that can read the token file. On a shared or multi-user host, run
--no-mcpor keep the token readable only by your account. - Caps: at most 32 concurrent connections (503 "Too many MCP connections") and a tighter 16 SSE sessions (503 "Too many sessions").
- Flags:
--no-mcp,--mcp-port,--mcp-token-file,--headless(see Running & modes).
While an MCP request is running, the desktop UI shows a modal lock and blocks local edits (except a read-only allow-list), with a Cancel MCP execution button:
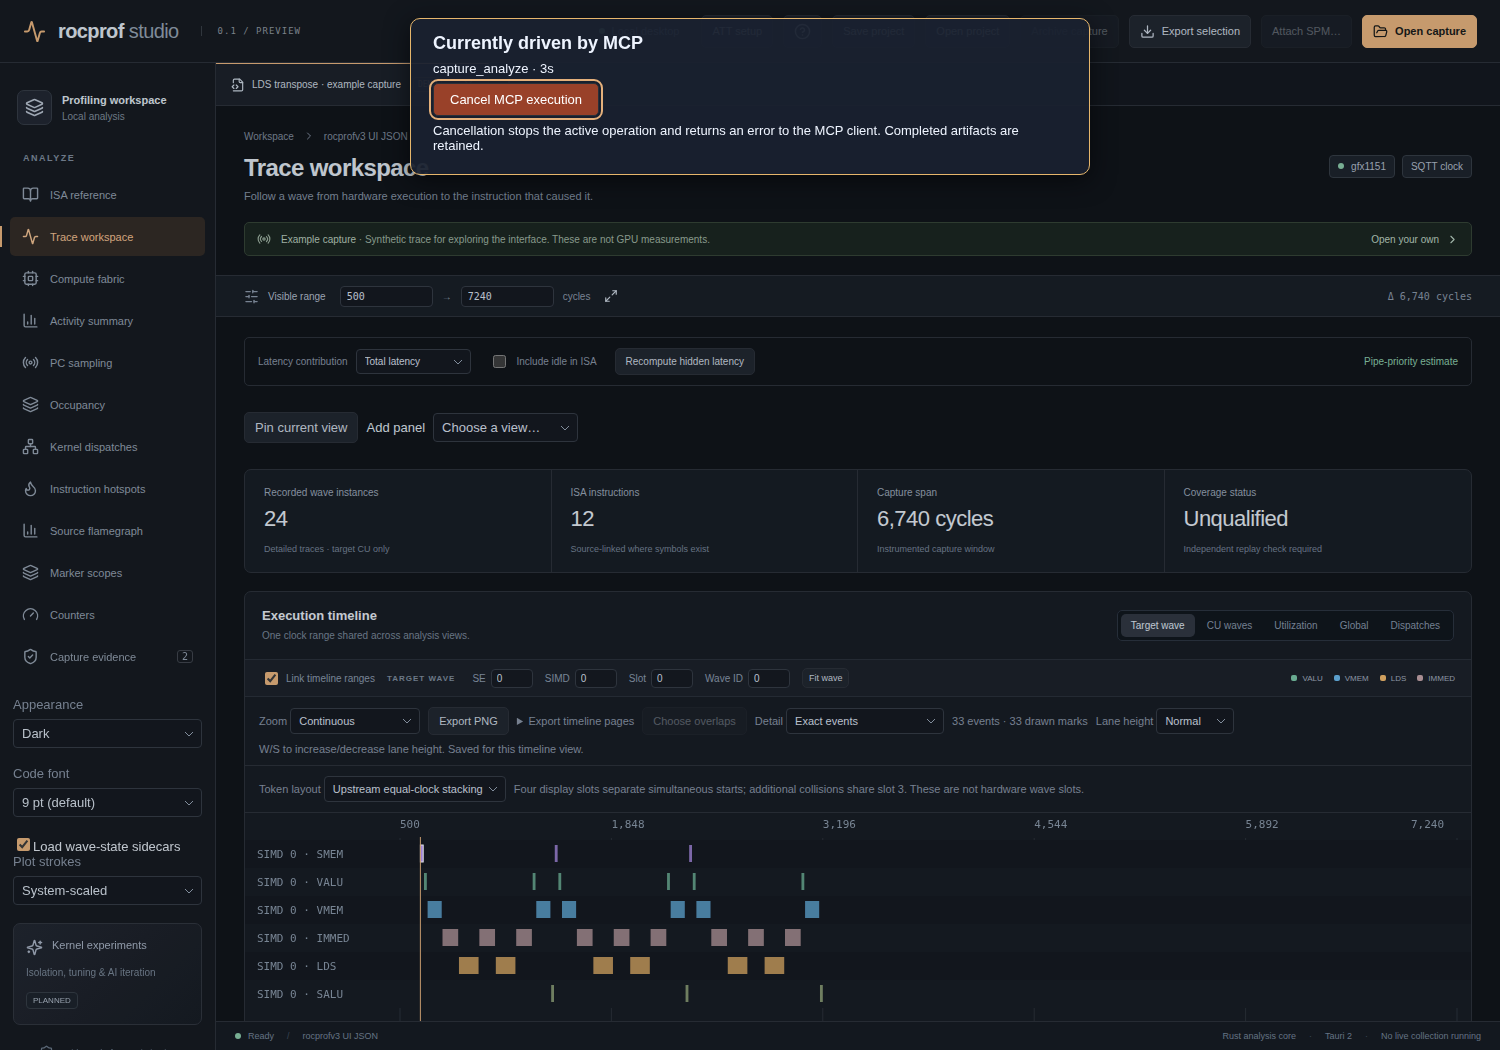 Rendered from the live
 McpControl component: "Currently driven by MCP · capture_analyze · 3s", with a Cancel button that calls mcp_cancel.
When idle, the app shows the endpoint details it is serving:
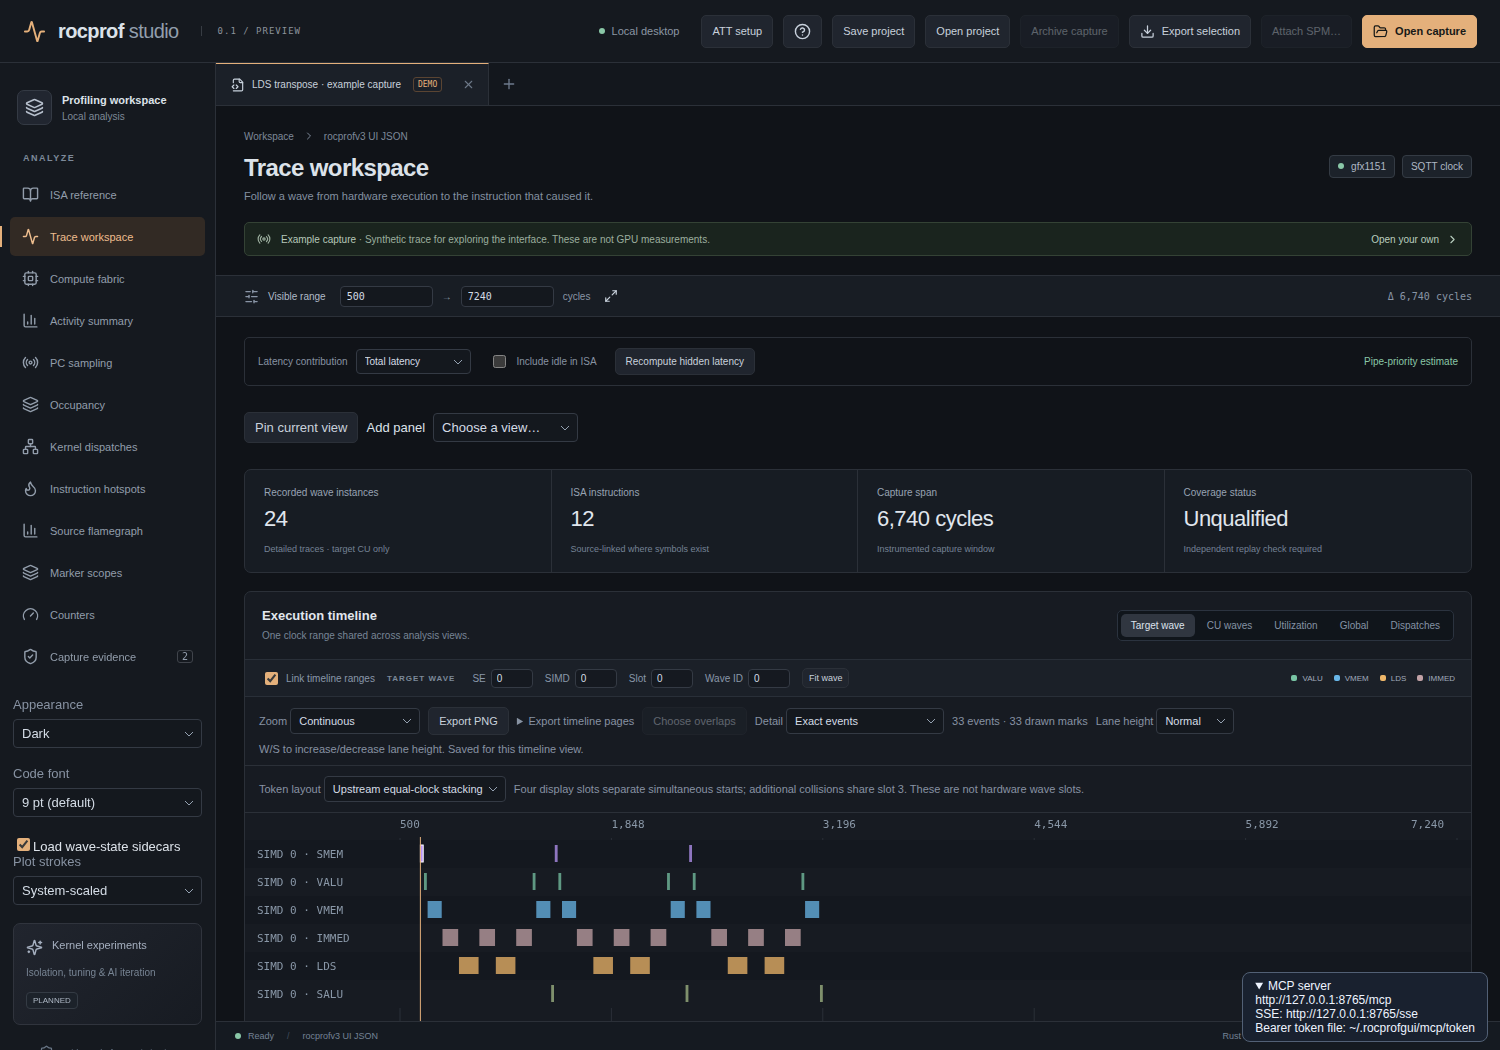 The connection panel: the
 /mcp URL, the legacy /sse URL, and the bearer-token file path.
How this tool list was obtained
The tool inventory below was captured from an installed 0.2.1 server with an isolated data directory on a free port. The argument and analysis contracts have been reviewed against the 0.3.0 source; this release review did not probe or redeploy the installed service:
bash
ROCPROFGUI_HOME=/tmp/rps-home rocprof-studio --headless --mcp-port 8791Then initialize → notifications/initialized → tools/list were sent over the legacy SSE transport and the returned JSON schemas turned into the table. The live server reported serverInfo {name: "rocprof-studio", version: "0.2.1"} and 31 tools.
Count check
The recorded 0.2.1 tools/list returned 31 tools; the 0.3.0 source retains that inventory. Some internal notes say 27; that count predates the four staged-profiling tools (profile_start, profile_trigger, profile_status, profile_stop). Trust 31.
Tool reference (31 tools)
Required arguments are marked *.
Capture & workspace
| Tool | Purpose | Key arguments |
|---|---|---|
workspace | List open captures, tuning sessions, current view and MCP status. | — |
capture_open | Import a trace / counters / ATT run / sampling / portable capture from a path. | path*, samplingMethod, loadWaveStates |
capture_close | Close an imported capture. | captureId* |
capture_query | Page/search a capture dataset (summary, dispatches, instructions, waves, counters, markers, hostCalls, codeObjects, intervals, events, eventCounters, monitorIntervals, otherSimd, metadata, sources, compileReports). Limit ≤ 1000. | captureId*, dataset*, query, offset, limit |
capture_export | Export a portable capture to a new path. | captureId*, path* |
workspace_select | Follow a capture/view/range/wave/instruction/dispatch in the GUI. | captureId*, view, range, waveId, instruction, dispatchId, se, timeline |
project_open | Open a project and restore its captures/workspace. | path* |
project_save | Write a project document to a new path. | path*, project |
:::note Loom compile reports as static facts capture_query with dataset: "compileReports" returns the imported Loom compile-time facts — one row per report, each with report- and per-entry identity, detail flags, target resources (SGPR/VGPR final counts and scheduled pressure, subgroup geometry, static occupancy percent, limiting resource, residency summary), instruction mix, allocation/spill and emitted-instruction counters, wait plan and workload geometry. Every row carries unit: "static" and the version-zero/same-compiler-horizon stability label: these are compiler evidence, never measurements, dispatches or runtime counts, and absent fields stay absent rather than defaulting to zero. A capture with no Loom report returns an empty list. See Input formats for the import contract. :::
Paging contract
List responses keep rows, total, offset, and nextOffset, and add effectiveLimit. The default is 100; requests above 1000 are clamped, including existing limit: 2000 calls. Continue with the returned nextOffset until it is null. A page shorter than the requested limit is not an EOF signal. limit: 0 is count-only: it can return the same offset and must not drive traversal.
json
{"captureId":"26","dataset":"dispatches","offset":0,"limit":2000}For 1001 matching rows this returns 1000 rows, effectiveLimit: 1000, and nextOffset: 1000; request offset 1000 for the last row. Search retains its case-insensitive serialized-JSON semantics, including keys, punctuation, nulls and nested samples. Rows above 4 MiB and selected arrays above 16 MiB fail explicitly without dropping rows. Lower limit for a page-byte refusal; a single oversized counter/report row needs capture_export and offline inspection. Summary, metadata and sources remain unpaged under a 16 MiB response budget; the source path inventory is still resident.
Analysis (read-only)
| Tool | Purpose | Key arguments |
|---|---|---|
capture_analyze | Run the GUI's own analyses: kernels, occupancy, activity, hardware, hotspots, source, markers, scalar, tensor; or render a dispatch/global timeline. Requires Node.js at runtime. | captureId*, analysis*, plus per-analysis options (formula, definitions, raw, metric, timeline, range, output, maxOutputBytes, …) |
wave_read | Read a detailed ATT wave (instruction execution + wait tokens). | captureId*, waveId* |
wave_overview | Bounded wave/timeline overview bins; optional SIMD-utilization model. | captureId*, indices*, range*, utilization, separateLds |
wave_analyze | Aggregate dynamic instruction statistics for selected waves and range. | captureId*, indices*, range* |
hidden_latency | Hidden/non-hidden latency analysis for detailed ATT waves. | captureId* |
source_map | Map recorded source paths from a prefix to a local directory. | captureId*, prefix*, directory* |
source_read | Read paged source (recorded capture source, or an explicit local path). | path*, captureId, startLine, count |
reference_query | Search/page the embedded ISA & matrix-type docs (manifest, cdna1..4, rdna1..4, rdna3_5). | architecture, query, offset, limit |
Kernel and timeline analysis contracts
Kernel rows retain the GUI's exact numerical fields and ordering. Additive analysisMeta labels the full-capture scope, clock, recorded-data coverage, summed dispatch durations, summed matching residency lifetimes and per-kernel lifetime union. Outer total counts matching kernel rows. Zero residency values mean no matching recorded evidence, not measured absence of GPU activity. Cycle-domain point dispatches have no dispatch end timestamp and cannot establish dispatch duration. range and kernel remain ignored for kernels; query filters finalized rows. An output file contains all aggregate rows regardless of paging/query.
Timeline range selects exact events. limit, offset, query and kernel do not limit timeline events. Inline responses retain {html}; output responses retain {path}, with additive export counts, clock, coverage, complete warnings and effective limits. File output streams HTML with a 512 MiB / two-million-glyph ceiling; inline HTML is limited to 16 MiB / 100,000 glyphs. maxOutputBytes may lower the applicable byte ceiling, and a larger inline request must supply output.
json
{"captureId":"26","analysis":"timeline","timeline":"global","range":[100,200],"timePages":4,"lanesPerPage":12,"output":"/tmp/new-timeline.html","maxOutputBytes":67108864}Choose a new path: publication never replaces an existing file or symlink. timePages: 0 retains the default 1; lanesPerPage: 0 retains the default 12. Points at the lower range boundary now appear; upper-boundary points belong to the next half-open segment. Automatic subdivision preserves split-midpoint points exactly once. Positive-duration events crossing segments may still appear on adjacent pages; those glyphs are not distinct dispatches.
Kernel and timeline transport excludes unrelated capture datasets. Exact kernel union still has state bounds, and dense timeline windows may be impossible to subdivide. Explicit refusals do not return partial totals or sampled events. Use positive-limit dispatch/interval queries with nextOffset for offline aggregation; union intervals globally rather than adding per-part unions. Other analyses still materialize relevant datasets under 256 MiB encoded input, and diagnostics still needs the full capture. Activity null retains its historical meaning: instruction timing is absent, invalid, or has no positive finite total. A dispatch CSV alone cannot supply instruction activity.
Evidence & artifacts
| Tool | Purpose | Key arguments |
|---|---|---|
definition_file | Read or write a counter-definition file using the GUI's validation. Writes require a new path. | op*, path*, text |
plot_export | Save validated SVG/HTML text or PNG bytes to a new path. | format*, path*, text, bytes |
code_object_extract | Extract a recorded code object into a new file (optional source relocation). | captureId*, objectId*, output*, sourcePath |
att_discover | Discover ATT runs in a directory. | path* |
att_manifest | Write an ATT manifest to a new path (same schema as the GUI). | manifest*, path* |
spm_attach | Attach SPM data to a trace via shader-engine clock anchors; save and open the combined capture. | captureId*, path*, se*, output* |
Profiling (launches programs)
| Tool | Purpose | Key arguments |
|---|---|---|
profile_run | Run an argv under a profiler and return output files to import. tracer rocprofv3 (default) collects, combinable in one run, counters (--pmc), traces (stream names kernel, hip, marker, memoryCopy, memoryAllocation, scratchMemory, hsa, rccl, runtime, sys) and att (SQTT thread trace; options targetCu, simdSelect, bufferSize, shaderEngineMask); with none of the three it collects a kernel trace. Kernel filters (kernelIncludeRegex, kernelExcludeRegex) and kernelIterationRange (--kernel-iteration-range, e.g. 64 or 0-3) narrow collection to specific dispatches. tracer radv is per-submit Vulkan capture (experimental). | argv*, cwd*, profiler, tracer, counters, traces, att, kernelIncludeRegex, kernelExcludeRegex, kernelIterationRange, env, timeoutSeconds |
profile_start | Start a long-lived application for gated live profiling. tracer radv (default): a Vulkan server under RADV RGP file-trigger capture. tracer rocprofv3: a HIP/ROCm application armed with ROCP_TOOL_ATTACH=1, so each trigger attaches rocprofv3 for one bounded time window (profiler overrides the rocprofv3 path). Returns an ID and log paths immediately. | argv*, cwd*, env, tracer, profiler |
profile_trigger | Fire one capture in a live profile. RADV: creates the file that arms one RGP capture. rocprofv3: attaches and collects the selected streams (same counters/traces/att/kernel filters/kernelIterationRange as profile_run) into a window-N/ directory. A window is timed (windowMs, default 5000, detaches on its own) or triggered (triggered: true, no windowMs, stays attached until {"end": true} writes a newline to rocprofv3's stdin, or profile_stop). On a busy-queue attach abort it retries with backoff and reports attachAttempts. | id*, windowMs, triggered, end, counters, traces, att, kernelIncludeRegex, kernelExcludeRegex, kernelIterationRange |
profile_status | Whether the profiled process is running. RADV: also whether its trigger is pending and how many RGP saves RADV announced. rocprofv3: also windowRunning and, for a triggered window, windowTriggered. | id* |
profile_stop | Stop a live profiled application and collect artifacts: .rgp files (RADV), or every window's trace/counter CSVs, .att files and decoded output (rocprofv3; an open window is detached by newline/self-timer, escalated to SIGINT after ~30 s and SIGKILL only past 180 s). Warns on overwrites and on windows that produced no files. | id* |
Tuning (compiles candidates; can write source)
| Tool | Purpose | Key arguments |
|---|---|---|
tuning_open | Select one traced dispatch for tuning; a RADV dispatch opens a Vulkan single-shader session (experimental), anything else a HIP kernel session. | captureId*, dispatchId* |
tuning_status | Read a session: mode, source files, ISA, captured arguments, calibration, run metrics/deltas, output validation, job log. | id* |
tuning_action | Execute and await a tuning op: search, select, capture (captureScope reachable/all), run, save. | id*, request* |
tuning_close | Stop and close a session; its captured inputs and validation dumps are deleted (results, logs, source backups remain). | id* |
The raw tools/list JSON — the full schema for every argument of every tool — was saved as the evidence this table was generated from.
Desktop Live profiling panel
The four live-profiling tools (profile_start, profile_trigger, profile_status, profile_stop) also back a compact Live profiling panel in the desktop sidebar. It calls the same core through live_profile_* Tauri commands, so the launch, windowing and collection logic is shared, not forked: pick the tracer, enter the argv and working directory, start, trigger timed or triggered windows with streams, counters, ATT and its targetCu/simdSelect/bufferSize/shaderEngineMask sub-options, kernel include/exclude regexes and a kernel iteration range, watch windows and attach attempts, then stop to collect. The window duration is validated against the same 1–600000 ms bound the MCP schema enforces, and errors surface in the panel's own vocabulary rather than raw MCP tool names.
Profiling examples
One profile_run, three streams
With tracer: "rocprofv3" (the default), counters, traces and att combine into a single run: one rocprofv3 invocation, one job folder.
json
{"jsonrpc":"2.0","id":4,"method":"tools/call",
 "params":{"name":"profile_run","arguments":{
   "argv": ["/path/to/hip-app", "--iters", "100"],
   "cwd": "/path/to",
   "counters": ["SQ_WAVES", "SQ_INSTS_VALU"],
   "traces": ["kernel", "hip", "marker"],
   "att": {"targetCu": 1, "shaderEngineMask": 1}
 }}}
The returned files list holds counter_collection.csv, the *_kernel_trace.csv / *_hip_api_trace.csv / *_marker_api_trace.csv traces, the raw *_shader_engine_SE_RUN.att files and — when the decoder is installed — decoded ui_output directories. Import any of them with capture_open. Importing raw .att output needs the decoder prerequisites: rocprof-trace-decoder 0.2.2, pyelftools, and the native librocprof-trace-decoder.so (V2).
Gated windows on a long-lived HIP server
profile_start with tracer: "rocprofv3" launches the application armed with ROCP_TOOL_ATTACH=1; each profile_trigger then attaches rocprofv3 for one bounded time window:
json
{"name":"profile_start","arguments":{"tracer":"rocprofv3","cwd":"/path/to",
 "argv":["/path/to/llama-server","-m","model.gguf"]}}
// → {"id":"…","pid":…} — wait for the server to become ready
{"name":"profile_trigger","arguments":{"id":"…","windowMs":5000,
 "counters":["SQ_WAVES"],"traces":["kernel","hip"],"att":{"targetCu":1}}}
// → send the workload now, poll profile_status until windowRunning=false;
//   trigger again for another window, or collect:
{"name":"profile_stop","arguments":{"id":"…"}}
// → every window-N/ directory's files, with per-window warnings
rocprofv3 window caveats
- Every window of one process must request the same collection: the same streams, counters, att, kernel filters, iteration range and mode (timed vs triggered). rocprofv3 pickles each PID's attach options and reattaches only with identical ones, so a mismatch is rejected up front, and an empty window still warns at
profile_stop. Within timed windows, onlywindowMsmay differ. rocprofv3 never deletes the/tmp/rocprofv3_attach_<pid>.pklit writes, so the app removes it best-effort atprofile_stopand at shutdown, keeping a reused PID from inheriting a stale attach spec. - Timed or triggered. A timed window (
windowMs) detaches on its own; a triggered window (triggered: true, nowindowMs) stays attached untilprofile_trigger{"end": true}orprofile_stop, so you can capture exactly one request without guessing a duration. Either way a window collects everything the application dispatches while it is open; it cannot isolate a single dispatch the way a RADV file trigger captures a single submit. {"end": true}only closes the open window. Collection options passed alongside it are rejected; using it on a timed window that has already run out reports that the window detached rather than a misleading error. A window launch that fails rolls back its directory and the collection it would have committed, so a failed attempt does not poison later triggers with a stale "File exists".- A default per-dispatch ATT trace samples each kernel name once. A name regex still takes the first matching dispatch; use
kernelIterationRangeto reach a specific later launch. - Attach can fail on a busy queue (the ROCm
set_profiler_active_on_queuehandshake).profile_triggerretries with backoff while the target is alive and reportsattachAttempts; a persistent failure is surfaced as anattachWarning, with a per-window warning atprofile_stopcarrying rocprofv3's stderr tail. This is a known ROCm limitation, not fixed here. - Detachment can lag the end of the window.
profile_statusreportswindowRunning(andwindowTriggeredfor a triggered window) until rocprofv3 has detached;profile_stopwaits for an open window to detach, sending SIGINT (rocprofv3's documented alternative detach) after ~30 s and SIGKILL only past 180 s.
Safety & boundaries
- Analysis tools are read-only.
capture_*(except open/close of in-memory state),wave_*,hidden_latency,source_read,reference_query,capture_queryonly read. profile_run/profile_startlaunch a program you supply.profile_runruns[profiler, --output-format csv, --output-directory <job dir>, …] -- <argv>with no shell, a default profiler of/opt/rocm/bin/rocprofv3, counter names validated to[A-Za-z0-9_], and a 600 s default timeout (max 3600 s).profile_startwithtracer: "rocprofv3"launches the argv itself (armed withROCP_TOOL_ATTACH=1); eachprofile_triggerthen runs the profiler with--attach <pid>for the window. Output goes to a job folder under~/.rocprofgui/mcp/jobs/and stays there (it is the capture).envis honoured except the runner's ownLD_PRELOAD/HSA_TOOLS_*/TMPDIRhandling. RADV writes to a fixed/tmppath, so a RADV run moves what it wrote into the job folder after checking for space.- Tuning tools compile and run candidate kernels/shaders, and
savewrites a replacement source definition back to disk. See Kernel tuning and Shader tuning. capture_analyzeneeds Node.js at runtime (it runs the frontend's own analysis modules bundled as a Node CLI).- Calls are serialized, except
tuning_statusandprofile_status, which answer while another call runs. After a dropped connection, repeat the same call with the same arguments — it joins the running call or returns its finished result. Cancel withnotifications/cancelledor the desktop Cancel button.
Client setup
Read the token first:
bash
cat ~/.rocprofgui/mcp/tokenClaude Code
bash
claude mcp add --transport http rocprof-studio \
  http://127.0.0.1:8765/mcp \
  --header "Authorization: Bearer $(cat ~/.rocprofgui/mcp/token)"
or a project .mcp.json:
json
{
  "mcpServers": {
    "rocprof-studio": {
      "type": "http",
      "url": "http://127.0.0.1:8765/mcp",
      "headers": { "Authorization": "Bearer PASTE_TOKEN_HERE" }
    }
  }
}
Claude Desktop
Claude Desktop speaks stdio, so bridge to the HTTP endpoint with mcp-remote in claude_desktop_config.json:
json
{
  "mcpServers": {
    "rocprof-studio": {
      "command": "npx",
      "args": [
        "-y", "mcp-remote",
        "http://127.0.0.1:8765/mcp",
        "--header", "Authorization: Bearer PASTE_TOKEN_HERE"
      ]
    }
  }
}
A generic MCP client
Point any Streamable-HTTP MCP client at http://127.0.0.1:8765/mcp with the Authorization: Bearer <token> header. Clients that only speak the older transport can use http://127.0.0.1:8765/sse plus POST /messages?sessionId=….
Raw JSON-RPC walkthrough
initialize over the Streamable HTTP endpoint (the response is an SSE message event):
bash
TOKEN=$(cat ~/.rocprofgui/mcp/token)
curl -s --max-time 10 -D - http://127.0.0.1:8765/mcp \
  -H "Authorization: Bearer $TOKEN" \
  -H "Content-Type: application/json" \
  -H "Accept: application/json, text/event-stream" \
  -d '{"jsonrpc":"2.0","id":1,"method":"initialize",
       "params":{"protocolVersion":"2024-11-05","capabilities":{},
                 "clientInfo":{"name":"demo","version":"1.0"}}}'
# → Mcp-Session-Id: <id>
# Example response from a 0.3.0 build:
# → data: {"id":1,...,"result":{"serverInfo":{"name":"rocprof-studio","version":"0.3.0"},...}}
The handshake is per-connection
This server ties the initialize → notifications/initialized → tools/list handshake to a single persistent connection. A naive sequence of separate curl calls gets "Send initialize and notifications/initialized first". Use a real MCP client, or the legacy SSE transport (open one GET /sse connection, read the endpoint event, then POST all three messages to /messages?sessionId=… and read the responses off the SSE stream). The reference table above was generated exactly that way.
A real call once connected, e.g. list open captures:
json
{"jsonrpc":"2.0","id":3,"method":"tools/call",
 "params":{"name":"workspace","arguments":{}}}