
Appearance
Export & evidence
rocprof studio treats "what can I prove from this capture?" as a first-class question. The exports below live mostly on the Capture evidence view.
Diagnostic manifest
Export diagnostic manifest writes a versioned JSON (schemaVersion 1, ≤ 16 MiB) describing the run, not the data: decoder configuration (selected interpreter, library and package path), capture metadata and warnings, record counts, field availability, workspace settings, and the SHA-256s of any source replacements. Raw trace data and source text are not embedded; the manifest is about provenance and coverage, so it is safe to share.
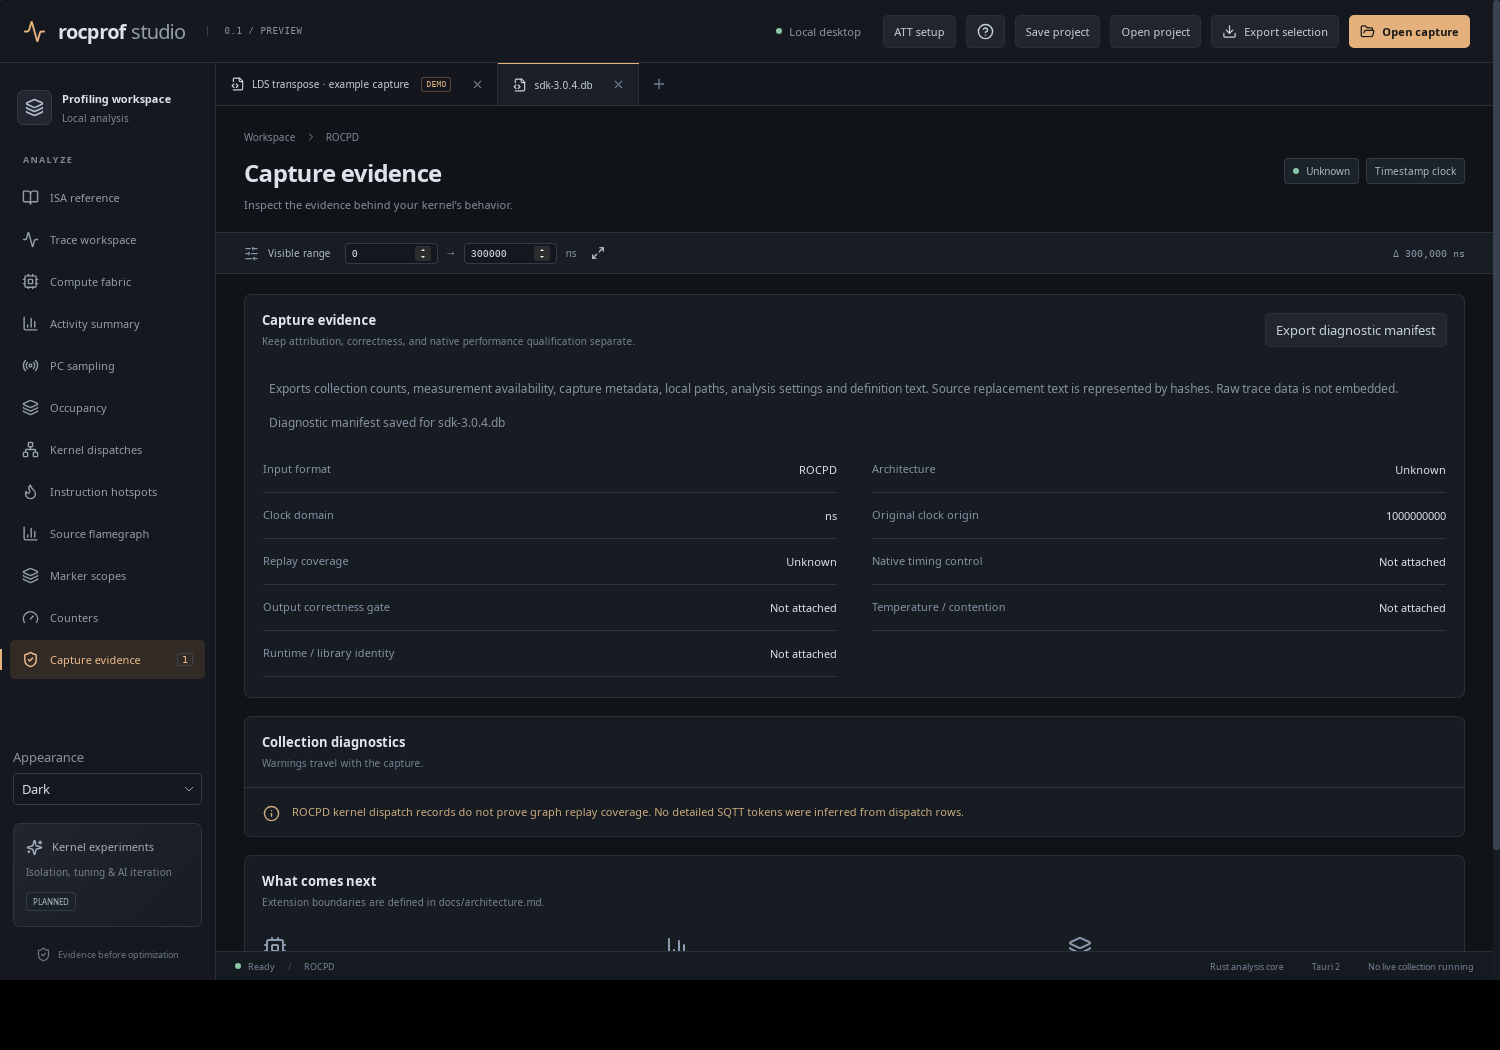
Note that decoder config fields record what was configured; native decoder availability is established by actually decoding, not by the presence of those fields.
Selection JSON
Export selection writes the current selection (range, wave, instruction, dispatch) as JSON. It is useful for quoting an exact spot in a capture to a colleague or to the MCP tools.
Plots: PNG and SVG
- Export PNG — the timeline viewport and lane page.
- Export SVG — occupancy, counter, histogram, flamegraph and CU diagrams.
- Exports are bounded to 16 MiB; above that the app refuses.
Timeline pages (printable HTML)
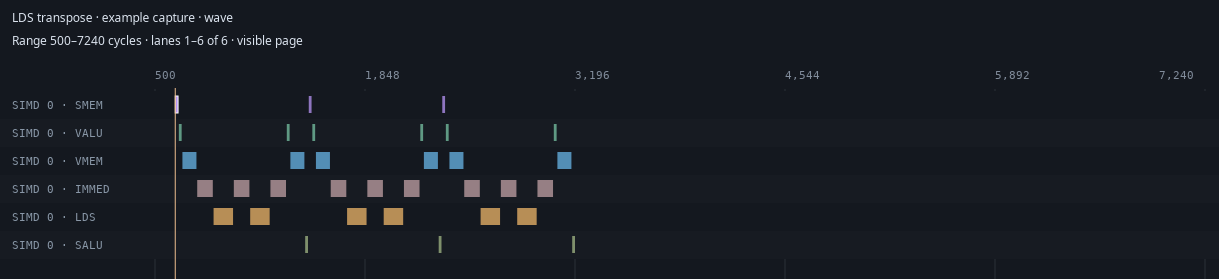
Export timeline pages produces a self-contained, printable HTML document: 1–64 time segments, 1–24 lanes per page, up to 512 pages. There are two paths with different drawn-record limits: the native streaming path allows up to 2,000,000 drawn records; the browser path allows 100,000 and caps the output at 16 MiB. Exceeding the limit is an error, not silent truncation.
Archive capture
Archive capture writes a portable .rocprof-capture that opens later without the original input directory or decoder. It is bounded (100,000 files, 128 MiB manifest, 128 GiB total, two-million instruction/observation caps).
Summed durations vs interval union — a deliberate distinction
Kernel intervals overlap, so three different questions have three different answers:
| Question | Accounting |
|---|---|
| How much GPU work ran? | Summed durations — add every interval. |
| How long was the GPU busy at all? | Interval union — merge overlapping intervals. |
| How long did the application wait? | Application latency — a different clock entirely. |
The dispatch view shows sum and union separately rather than collapsing them into one misleading total. Treat them as answering different questions.
Coverage diagnostics
The evidence view surfaces capture warnings and coverage notes. The governing rule, stated verbatim in the app: "Coverage cannot be proven from a dispatch CSV alone," and "No metric or diagram should be read as evidence that unobserved CUs, spills, bank conflicts or graph replays are zero." A real example from the project's own notes: a clean PM4 trace showed 301,692 non-graph kernels and zero hipGraphLaunch-correlated kernels while classic-graph attribution held 426,763 graph-replay kernels — valid-looking files did not prove coverage.